The Integration Paradox
First Results of a Meta-Analysis &
Proposal of a New Experimental Design
Merlin Schaeffer & Judith Kas (WZB)
2023-04-21
Tocqueville's Paradox

The hatred that men bear to privilege increases in proportion as privileges become fewer and less considerable,
[...]
the love of equality should constantly increase together with equality itself [...].-- Alexis de Tocqueville (2015 [1840])
Tocqueville's Paradox

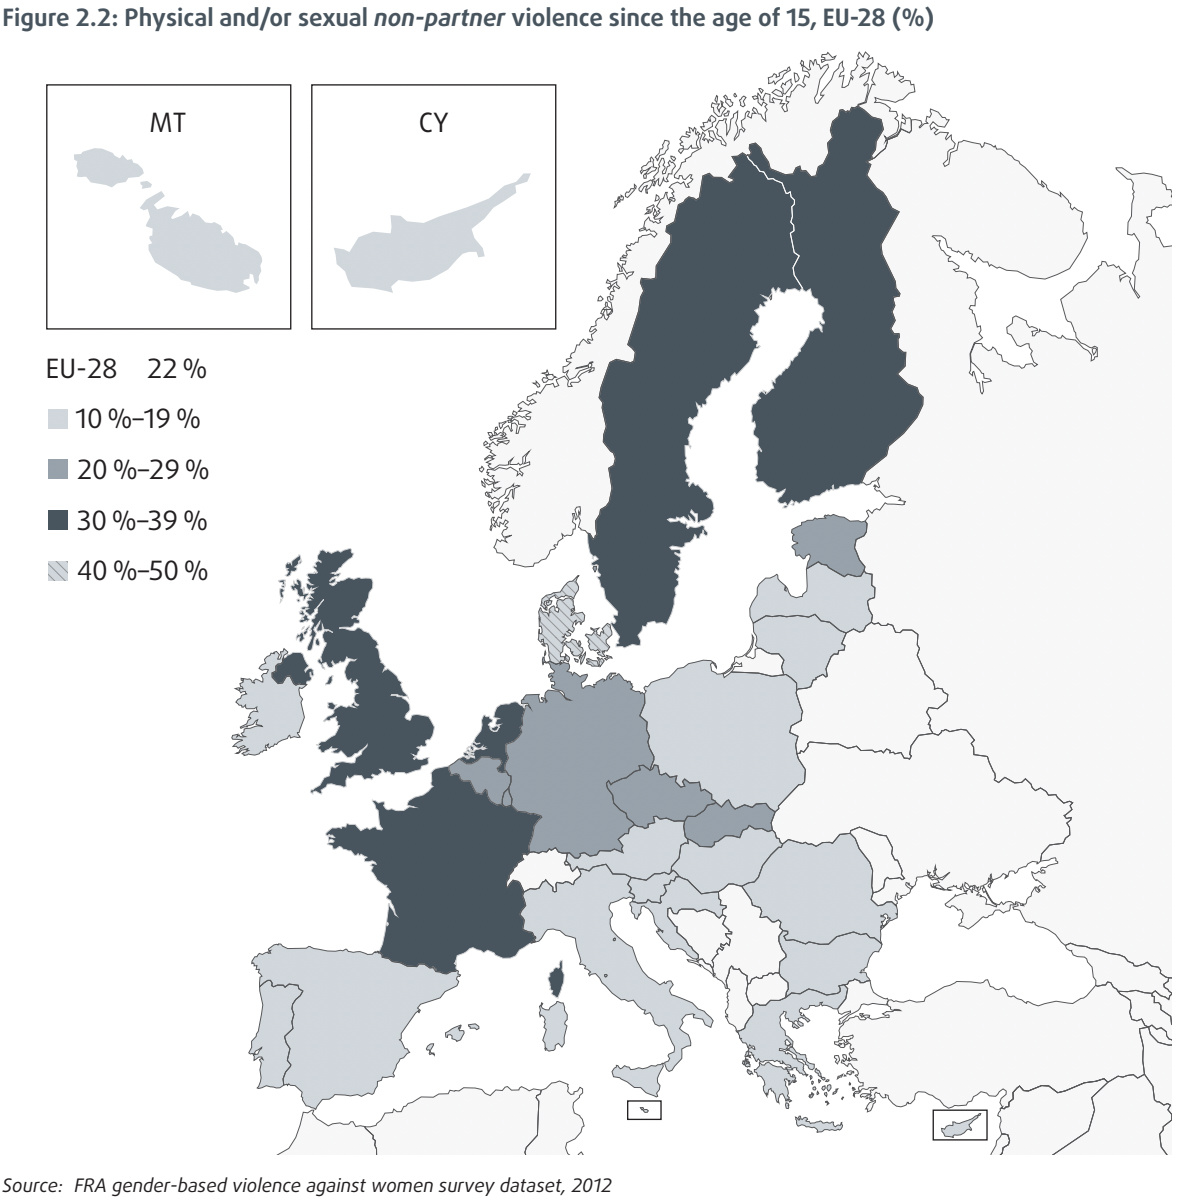
Source: European Union Agency for Fundamental Rights. (2014)
Tocqueville's Paradox

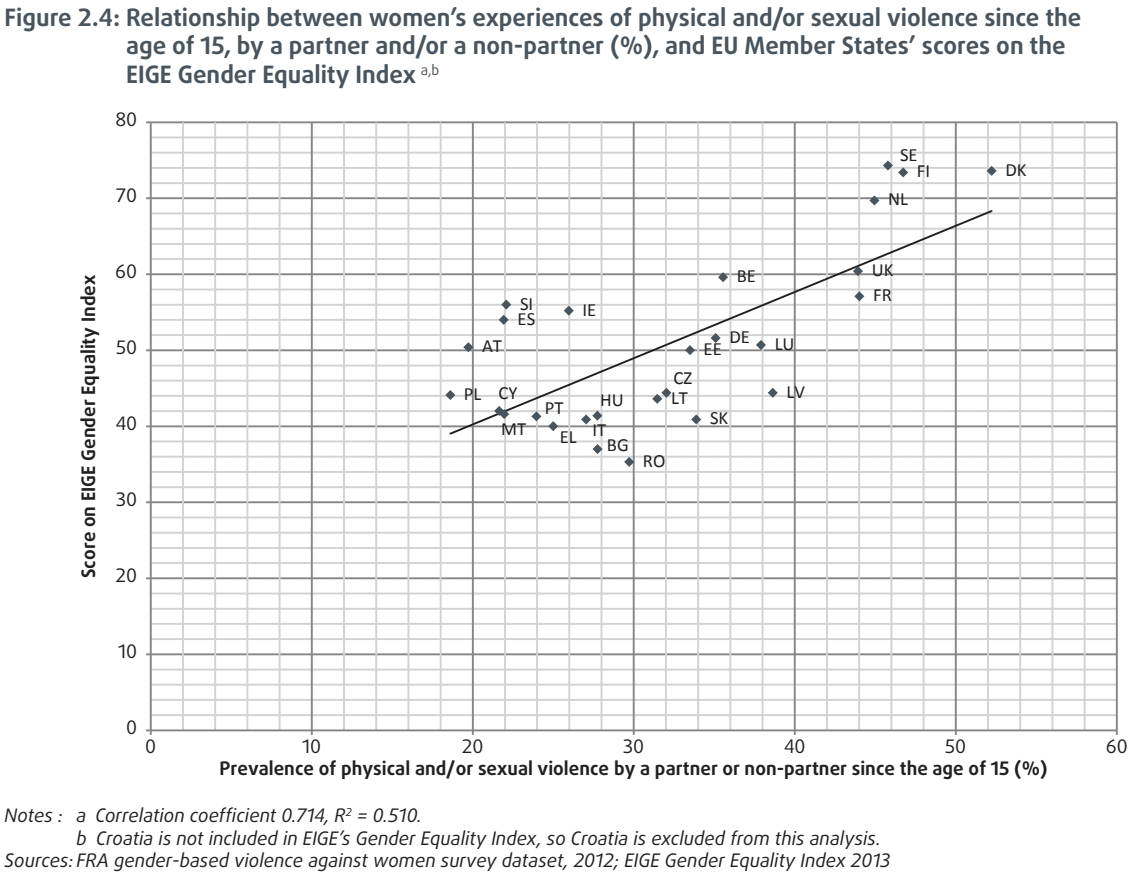
Source: European Union Agency for Fundamental Rights. (2014)
An integration paradox?
 Single family home in Berlin's suburb Rudow
Do immigrants and their descendants who established themselves among the middle-class mainstream report
less or more
discrimination than those who remain at the margins of society?
An integration paradox?
 Single family home in Berlin's suburb Rudow
[...] greater familiarity with the culture and language and some economic advancement can lead to greater consciousness of the reality of discrimination.
-- Portes, Parker, and Cobas (1980)
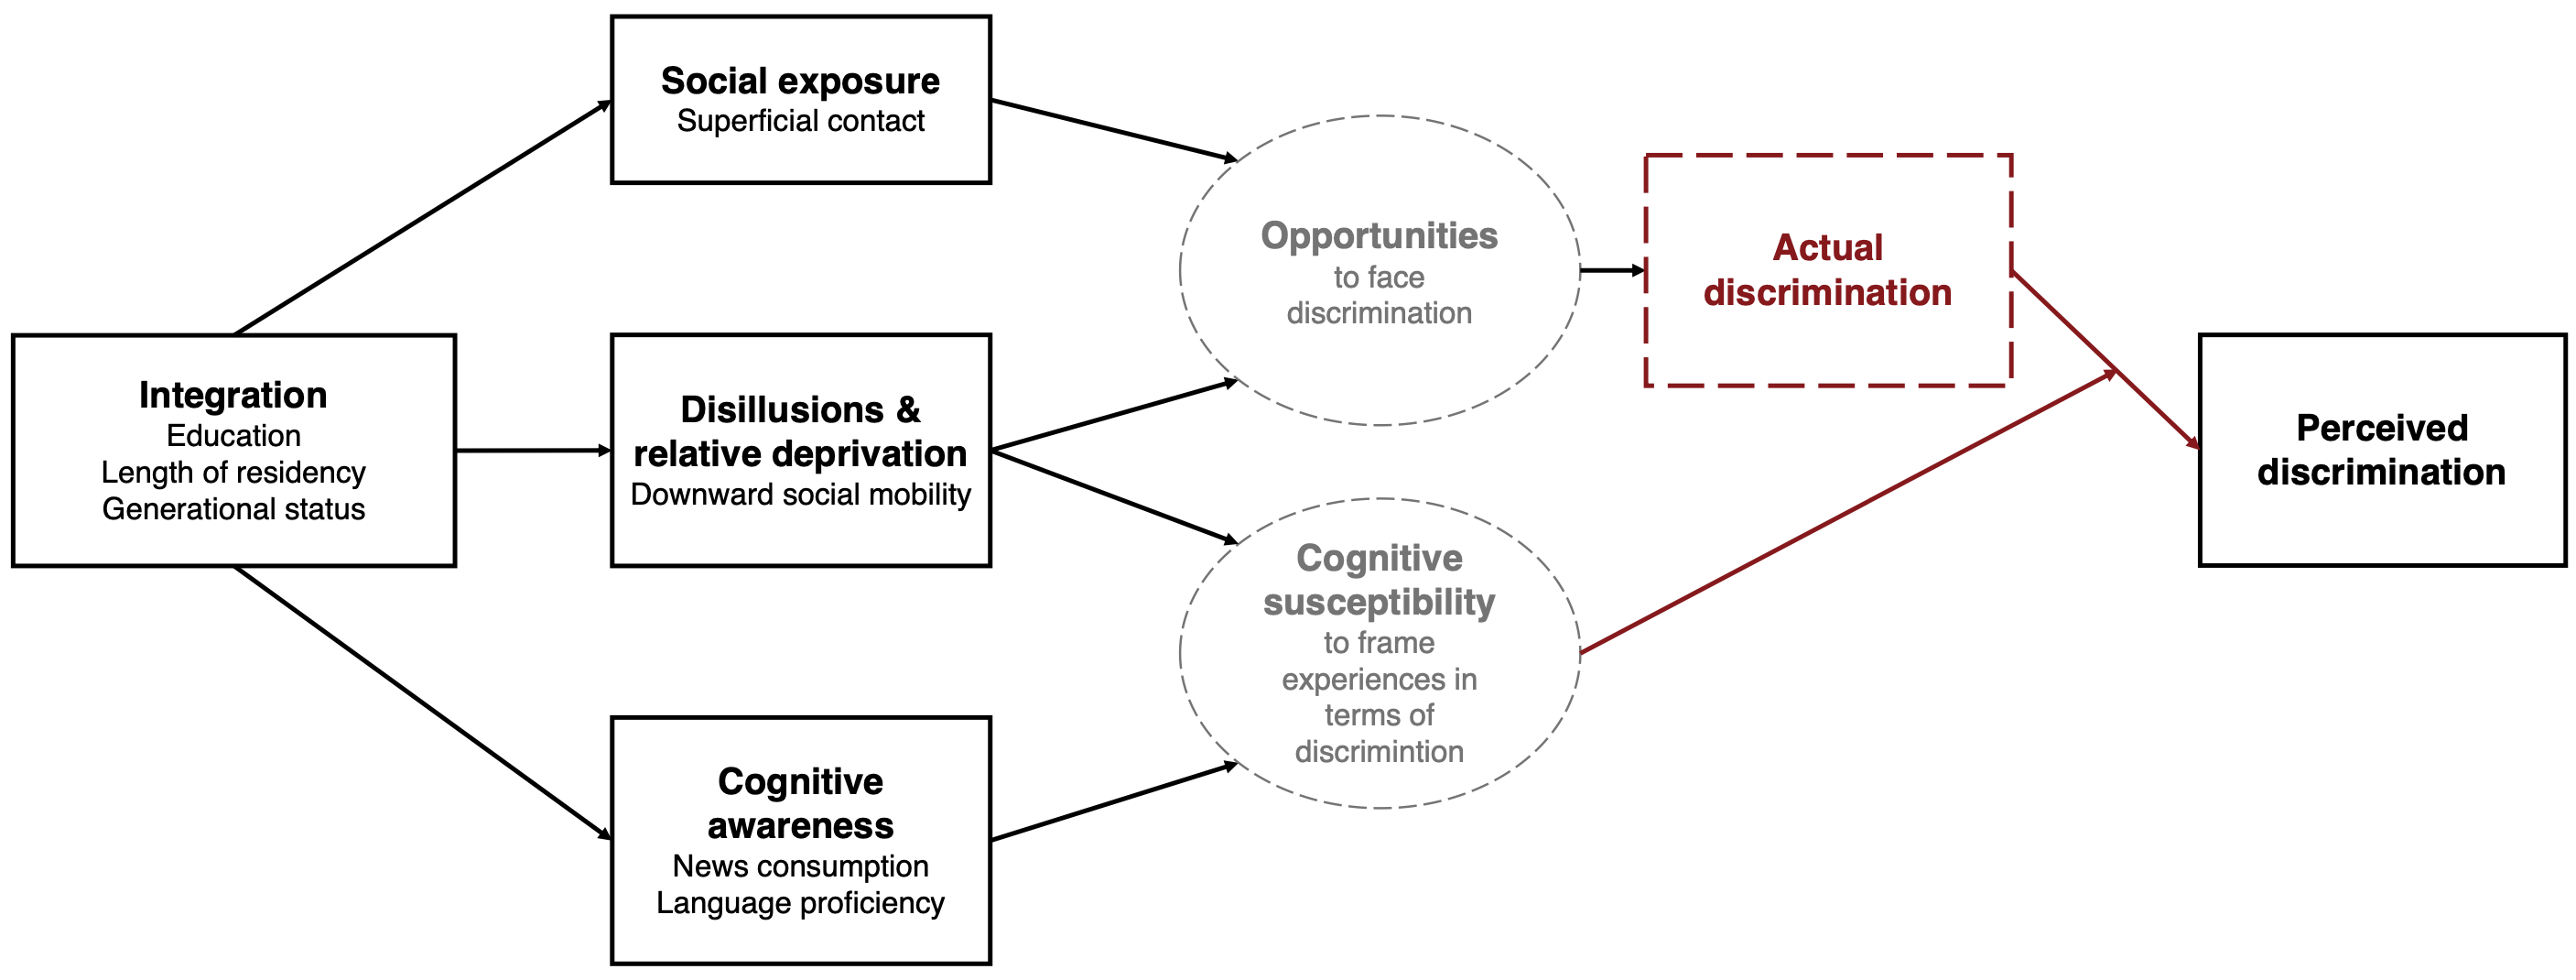
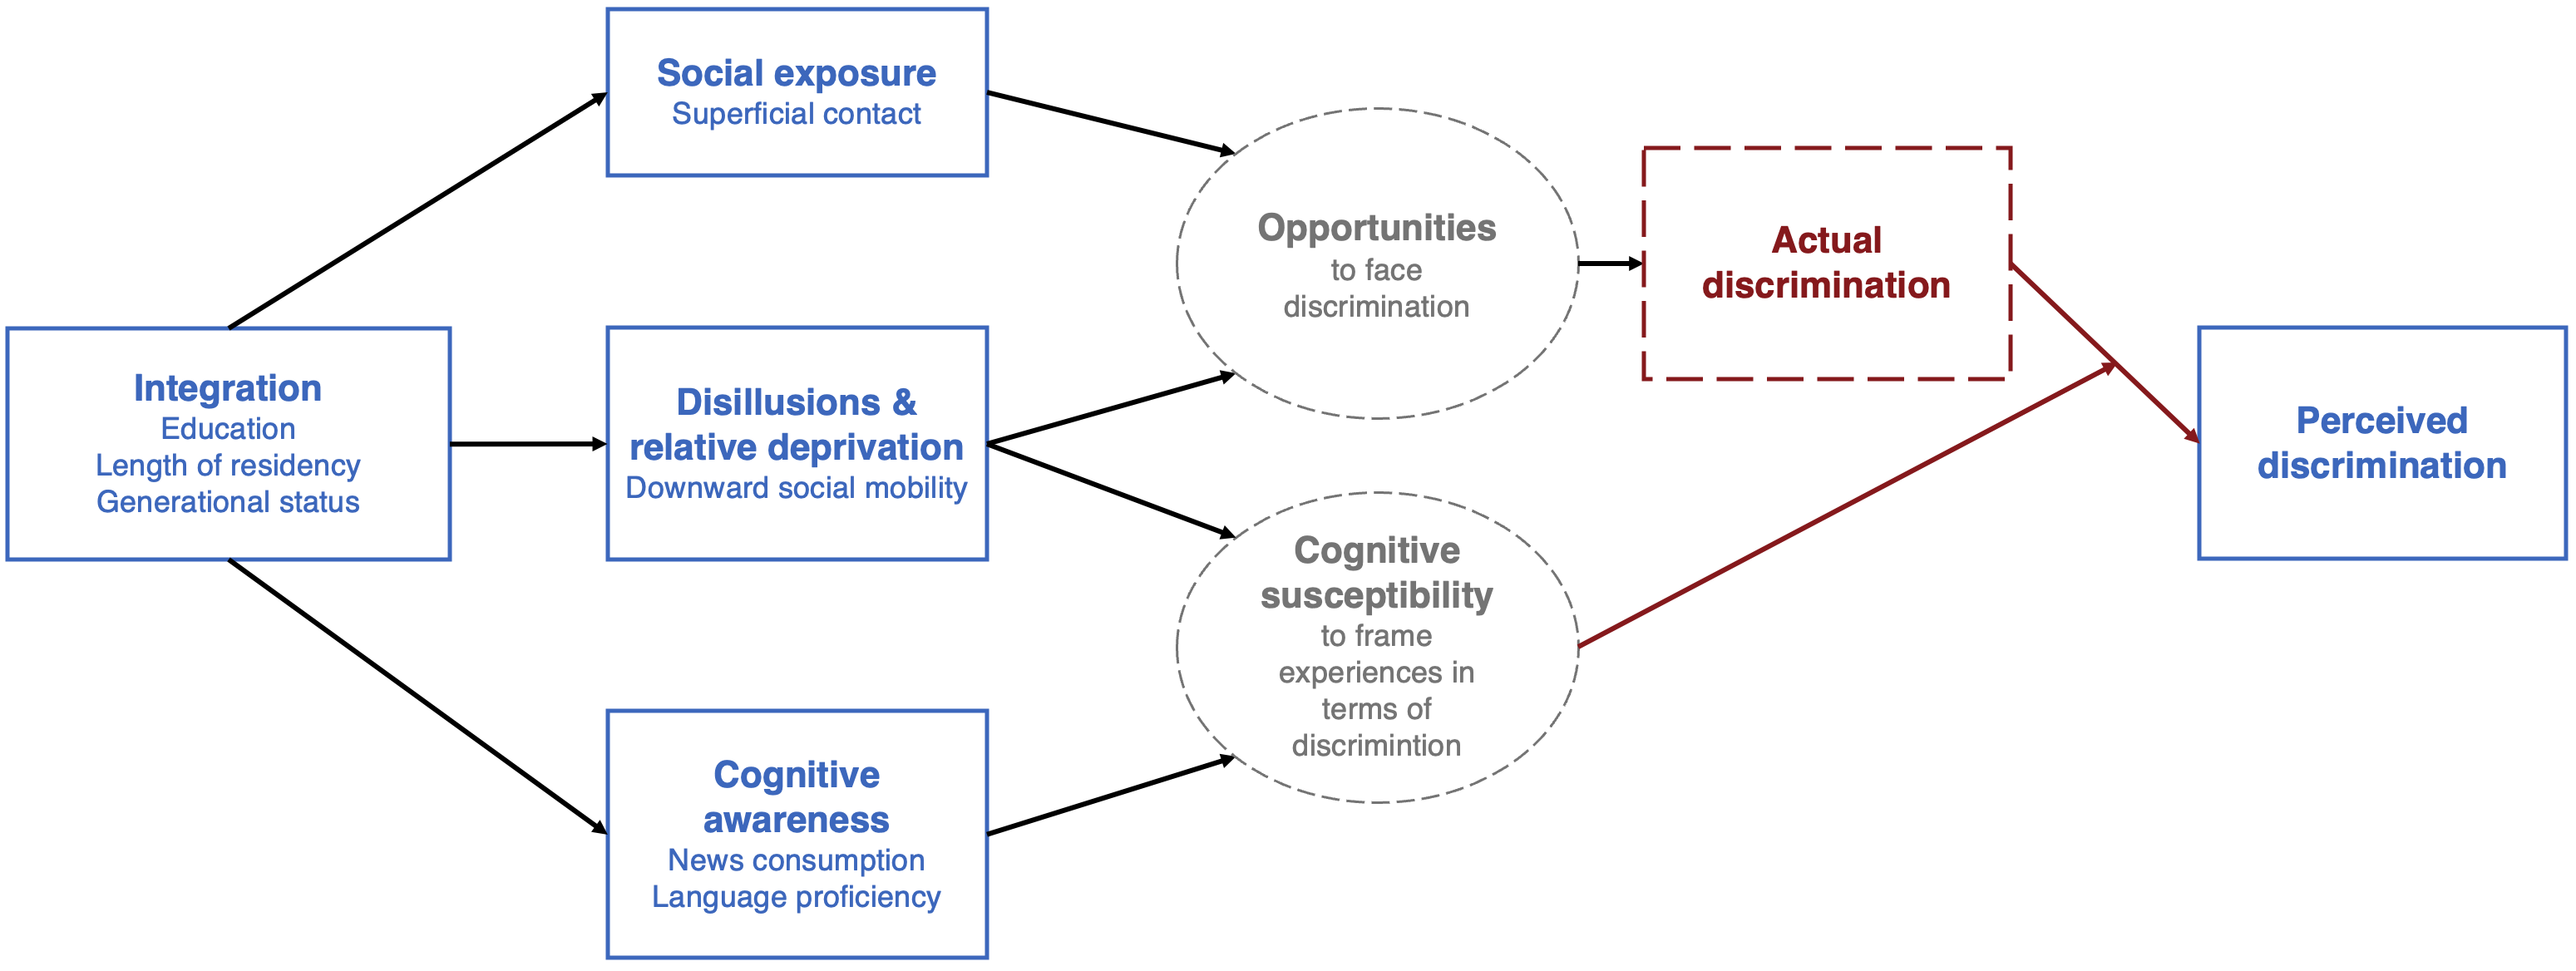
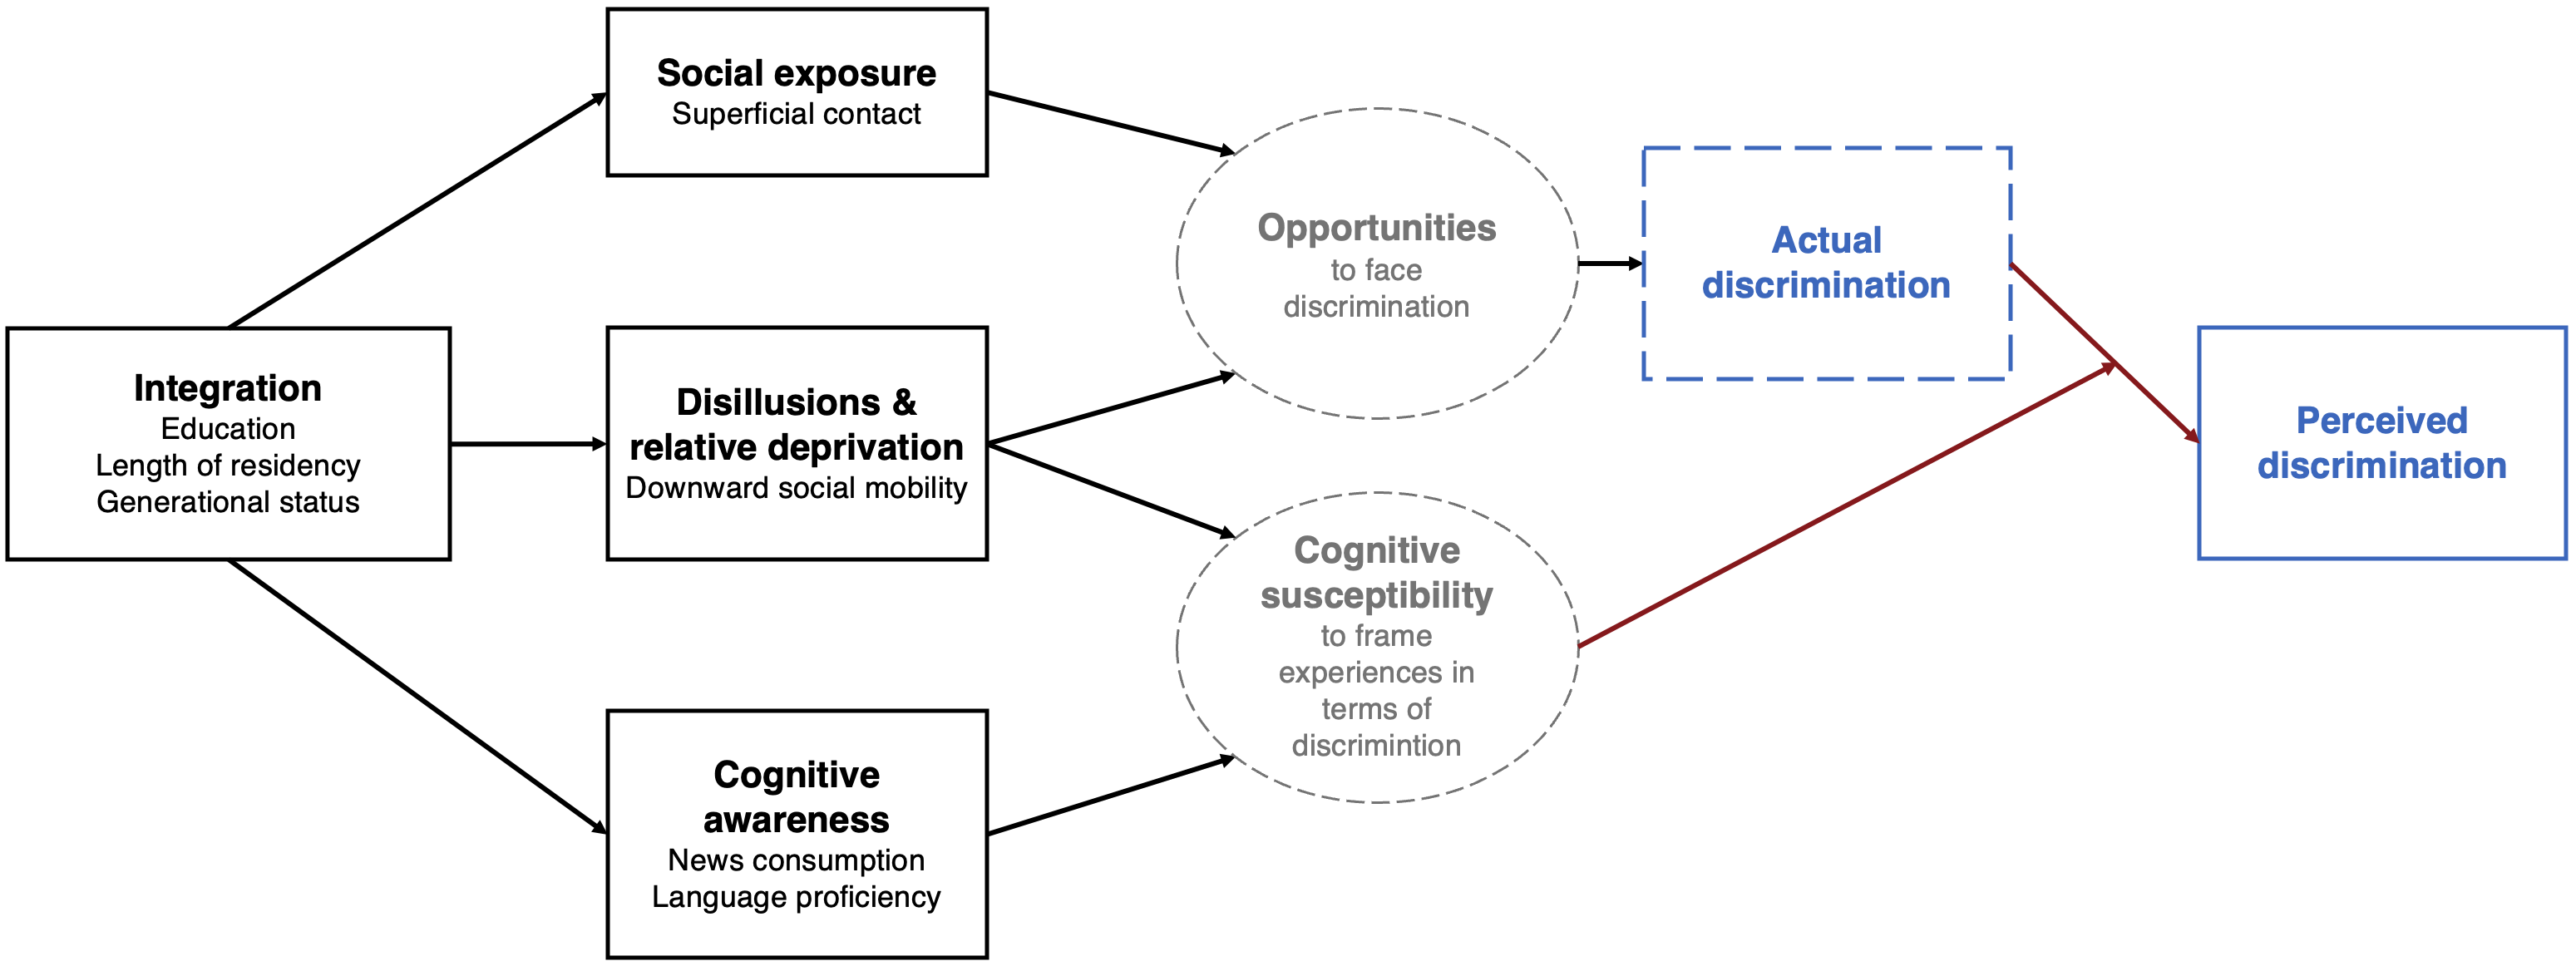
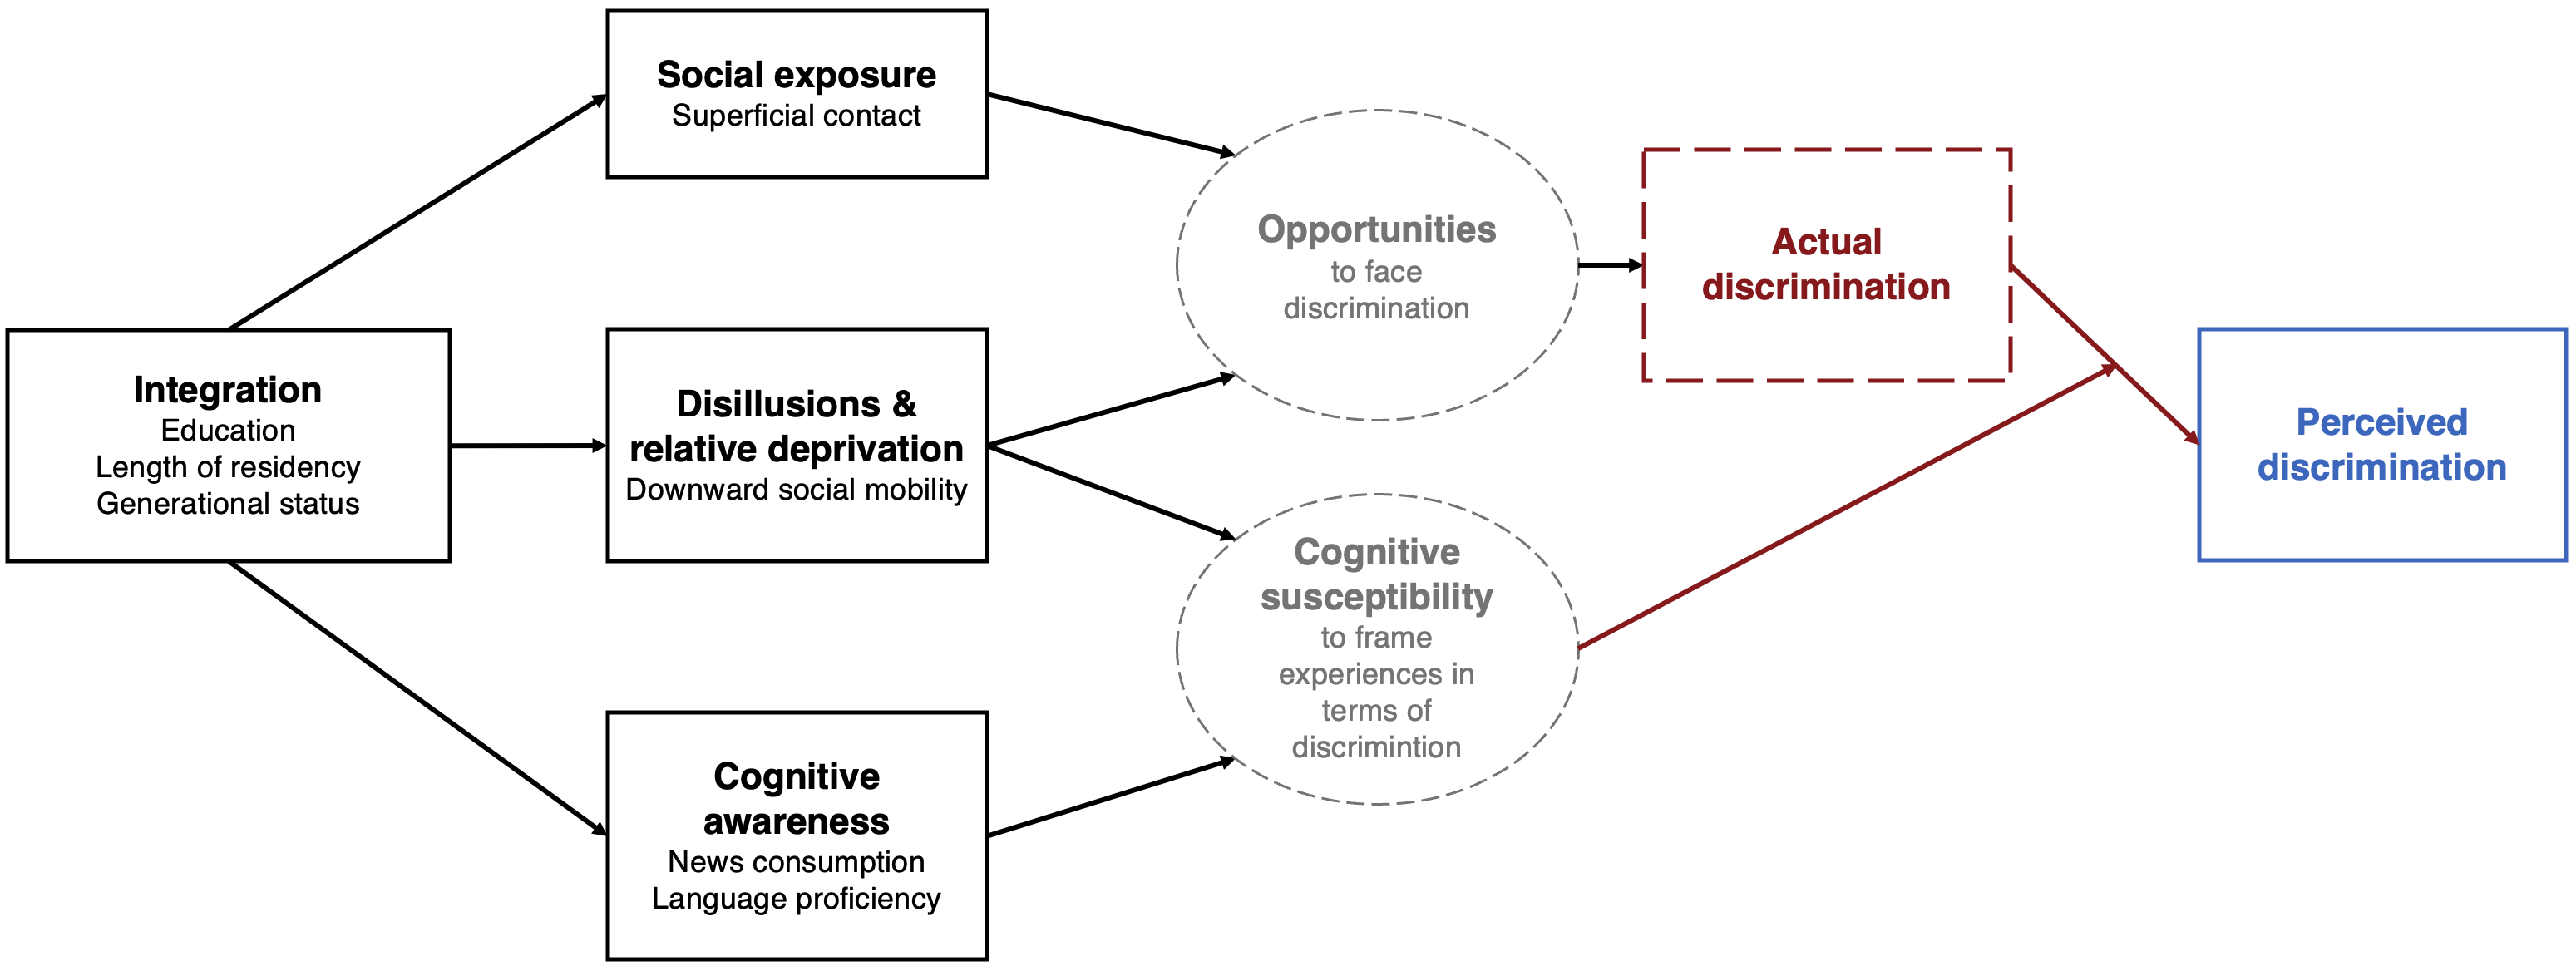
The integration paradox Synthesized theoretical model
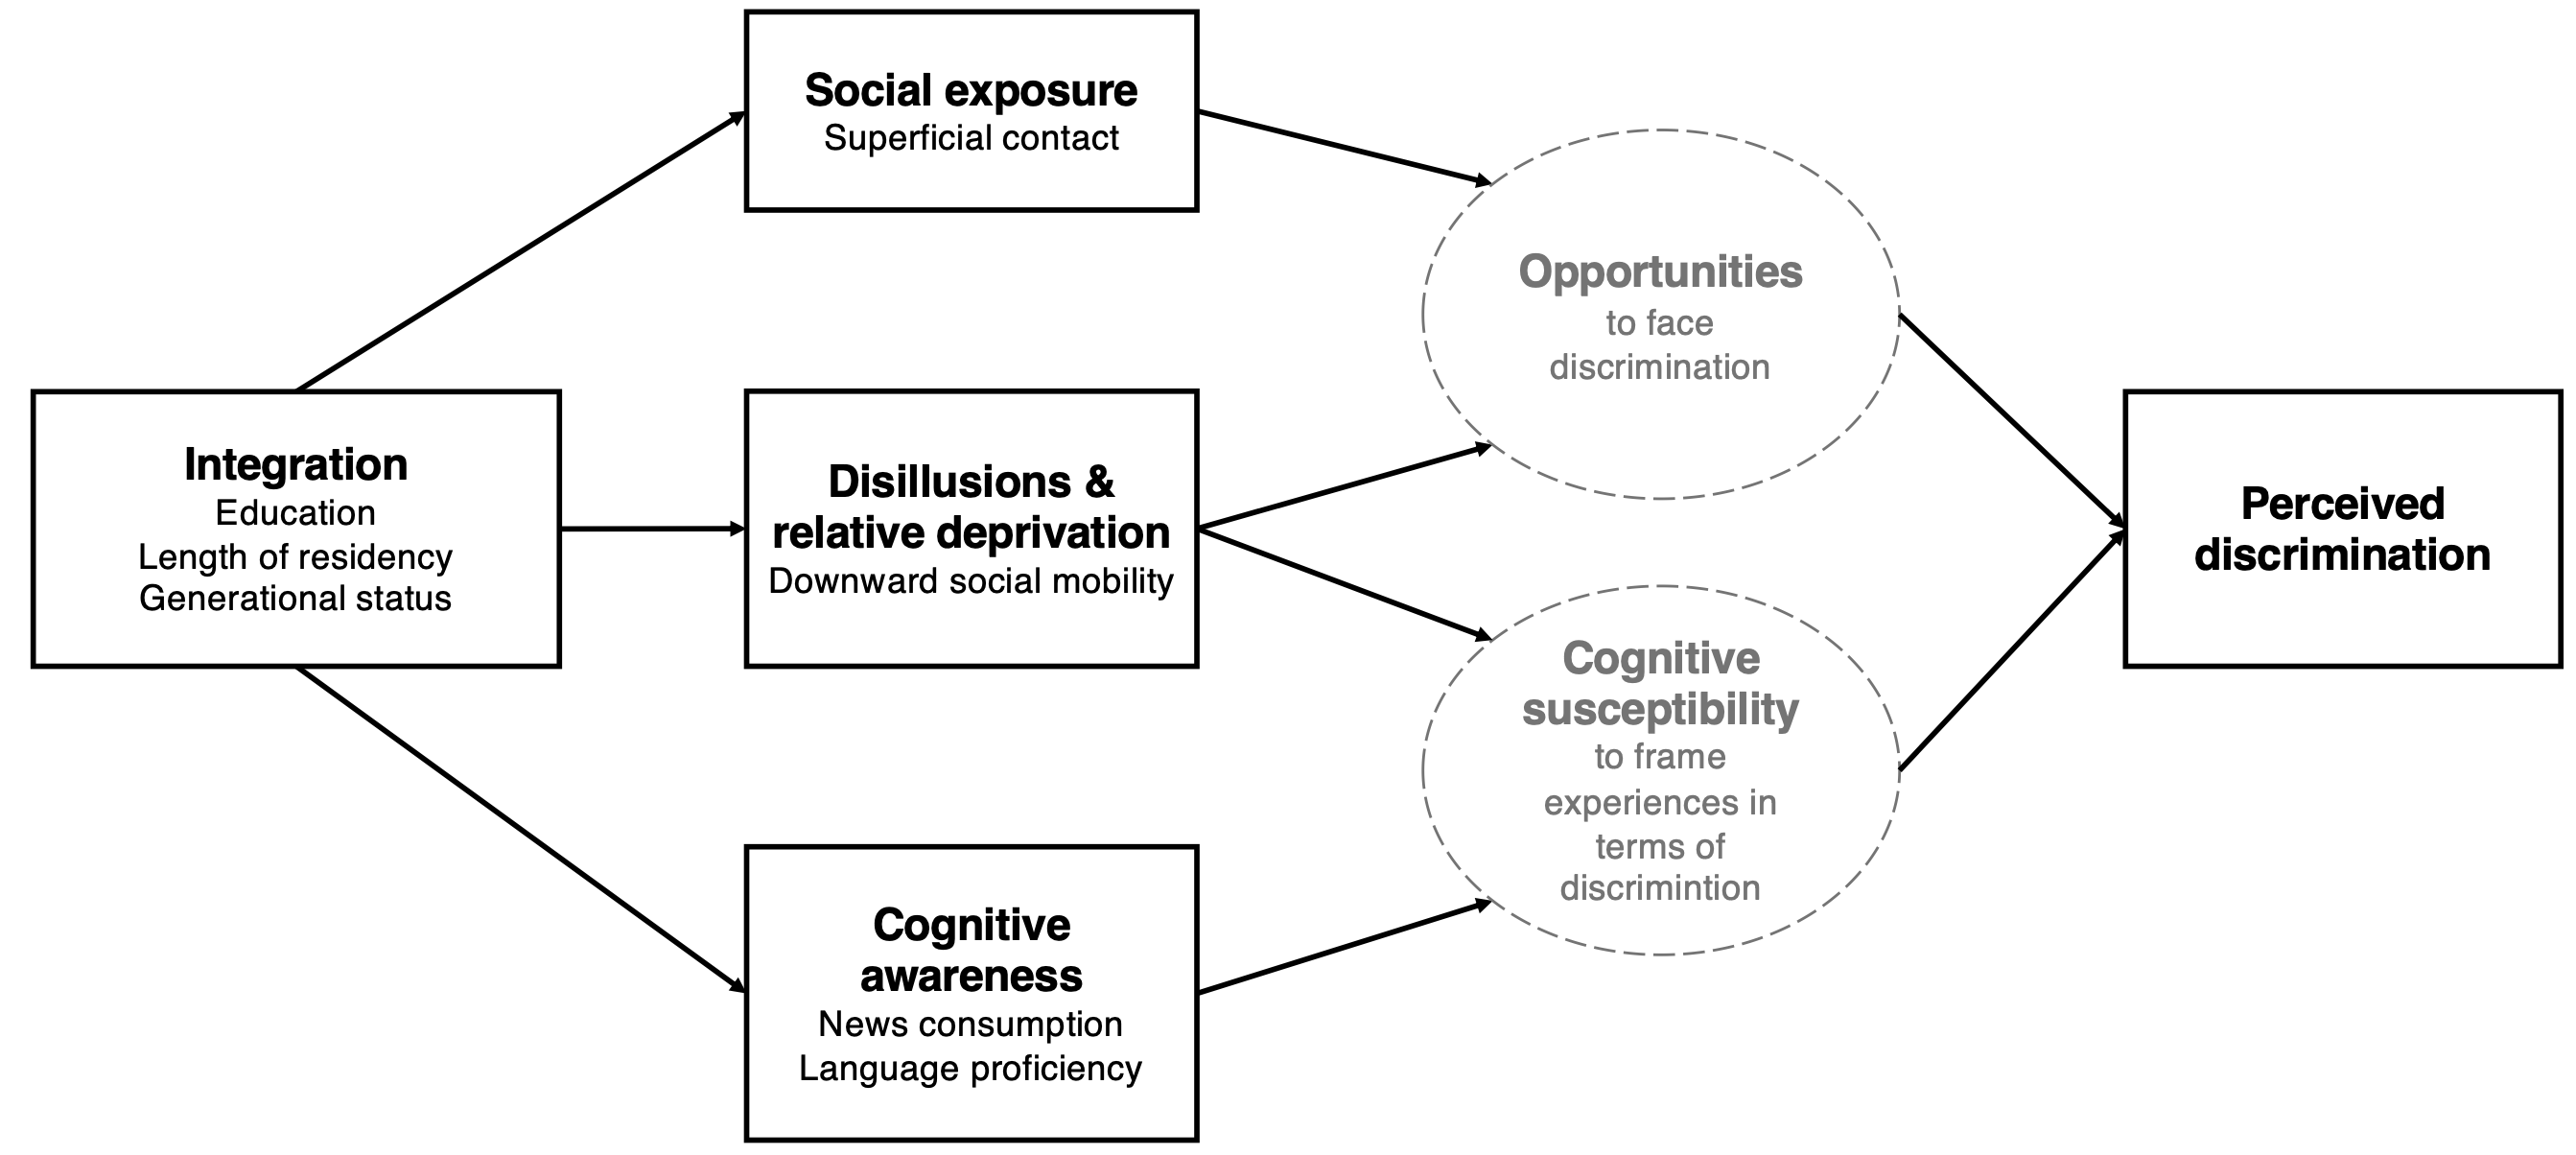
Meta-analysis Which reliable patterns has the literature produced so far?
Sample definition
- Outcome: perceived (ethnic) discrimination.
- Population: Immigrants, descendants of immigrants, or members of an ethnic, religious, or racial minority.
- Correlation or regression coefficient & associated inference statistic: Perceived discrimination and one of the following types of indicators of immigrant integration:
- Education, length of residence or generational status,
- Labor market attainment (e.g., income), exposure to persons of native-born parents (e.g., neighborhood share),
- Indicators of familiarity with public discourse (e.g., news media consumption),
- Indicators of (downward) social mobility
- Published in English & no MA theses.
Sampling
- 766 non-duplicate studies from WoS & Google Scholar via search string, 7 April 2021:
("integration paradox" OR "Paradox of Integration") AND discrimination
Sample Cleaning & pre-reg training
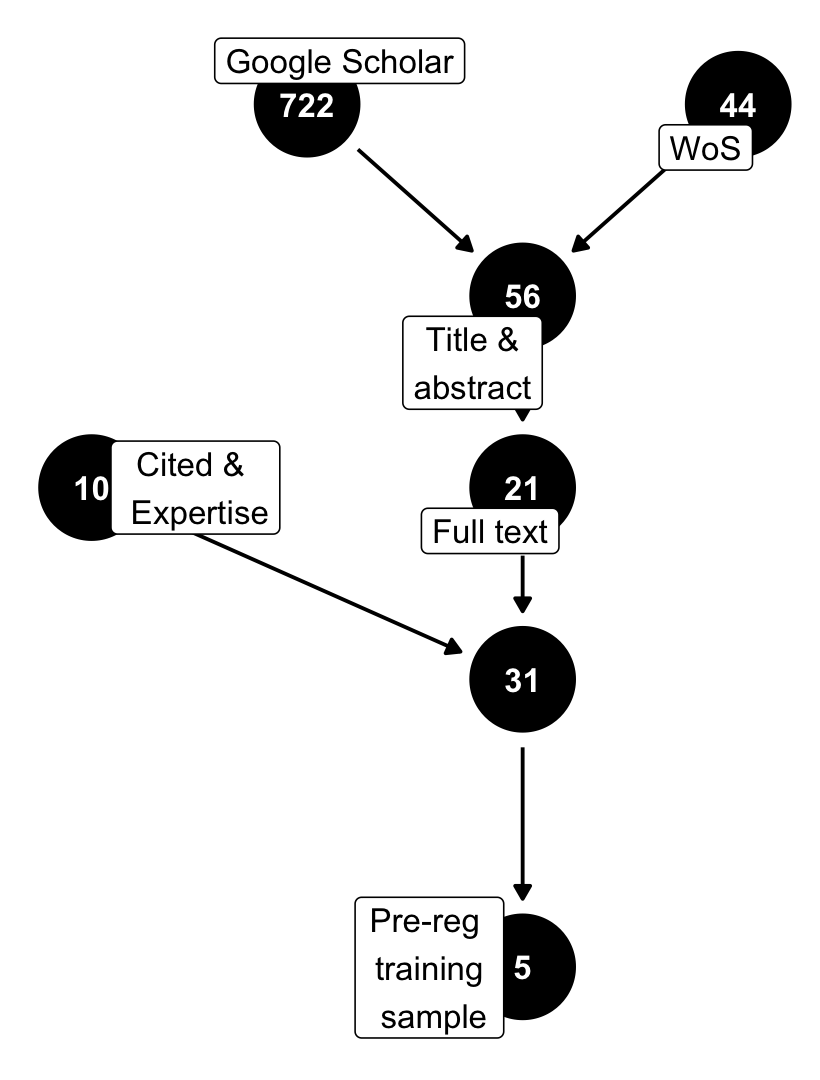
Sample Cleaning & pre-reg training

Coding
Outcome
ρyx⋅z=Cov(ex⋅z,ey⋅z)SDex⋅zSDey⋅z,=t√t2+df.
Source: Gustafson (1961)
Disadvantages: ρyx⋅z depends on z & is probably not accurate for estimates from GLMs.
Coding
Outcome
ρyx⋅z=Cov(ex⋅z,ey⋅z)SDex⋅zSDey⋅z,=t√t2+df.
Source: Gustafson (1961)
Disadvantages: ρyx⋅z depends on z & is probably not accurate for estimates from GLMs.
Predictors
- Original predictor:
- Broad indicators of integration
- Education
- Generation
- Length of residence
- Social exposure
- Contact to mainstream members
- Labor market attainment
- Awareness
- Media consumption
- Language skills
- Disillusion & relative deprivation
- Downward social mobility
- Broad indicators of integration
- Identifiability of immigrant population studied
- MIPEX by country-year
- Data analyzed.
- Nr. of good/bad controls.
- Nr. mediators.
- ...
Meta-analysis
ˉρyx⋅z=∑ni=1wiρ(yx⋅z)iwi,min
Fixed effects: w_{i} = \frac{1}{\color{orange}{\text{Var}(\rho_{(yx \cdot z)i})}}.
Random effects: w_{i} = \frac{1}{\text{Var}(\rho_{(yx \cdot z)i}) \color{orange}{+ \tau^2}},
where \tau^2 is the between-studies variance of \rho_{(yx \cdot z)i}. Commonly, \tau^2 is estimated via REML.
Meta-analysis
\begin{align*} \bar{\rho}_{yx \cdot z} &= \frac{\sum_{i=1}^n \color{orange}{w_{i}}\rho_{(yx \cdot z)i}}{\color{orange}{w_{i}}}, \\ \min \text{RSS} &= \min \sum_{i=1}^{n} \color{orange}{w_{i}} R_{i}^{2}. \end{align*}
Fixed effects: w_{i} = \frac{1}{\color{orange}{\text{Var}(\rho_{(yx \cdot z)i})}}.
Random effects: w_{i} = \frac{1}{\text{Var}(\rho_{(yx \cdot z)i}) \color{orange}{+ \tau^2}},
where \tau^2 is the between-studies variance of \rho_{(yx \cdot z)i}. Commonly, \tau^2 is estimated via REML.
Nested estimates:
- Code estimates for:
- strongest dummy contrast,
- full-sample, unless subsamples informative about identifiability,
- racial > ethnic > national > religious > linguistic discrimination,
- composite scale if available,
- max demographic (e.g., gender) & min subsequent outcomes (e.g., mental health) & altern. predictors as controls,
- No moderated/conditional coefficients.
- Use multilevel random effects meta-analytic models (Konstantopoulos, 2011), as implemented in R's metafor package (Viechtbauer, 2010).
rma.mv(yi = yi, V = as.matrix(vi), data = sample_1, test = "t", mods = ~ pred, random = list(~ 1 | Study_ID/ID), ~ 1 | data))Overall meta-estimate
# Sample definition#------------------sample_1 <- meta_data %>% # Only broad integration indicators, filter(pred == "Education" | pred == "Generation" | pred == "Length of residency") %>% # Within each indep. sample & type of predictor, group_by(study_ID, data, context, pred) %>% # Use sub-sample if available, filter(full_sample_num == max(full_sample_num, na.rm = TRUE)) %>% # Use model with least number of mediators filter(nr_mediators == min(nr_mediators)) %>% # Use model with min number of bad controls filter(nr_bad_controls == min(nr_bad_controls)) %>% # Use model with max number of good controls filter(nr_good_controls == max(nr_good_controls)) %>% # Use model with minimum number of integration predictors filter(nr_preds == min(nr_preds)) %>% ungroup()Overall meta-estimate
# Sample definition#------------------sample_1 <- meta_data %>% # Only broad integration indicators, filter(pred == "Education" | pred == "Generation" | pred == "Length of residency") %>% # Within each indep. sample & type of predictor, group_by(study_ID, data, context, pred) %>% # Use sub-sample if available, filter(full_sample_num == max(full_sample_num, na.rm = TRUE)) %>% # Use model with least number of mediators filter(nr_mediators == min(nr_mediators)) %>% # Use model with min number of bad controls filter(nr_bad_controls == min(nr_bad_controls)) %>% # Use model with max number of good controls filter(nr_good_controls == max(nr_good_controls)) %>% # Use model with minimum number of integration predictors filter(nr_preds == min(nr_preds)) %>% ungroup()Note: 20 partial correlation coefficients and overall meta-estimate with associated 95% confidence intervals, based on five coded studies.
Overall meta-estimate
# Sample definition#------------------sample_1 <- meta_data %>% # Only broad integration indicators, filter(pred == "Education" | pred == "Generation" | pred == "Length of residency") %>% # Within each indep. sample & type of predictor, group_by(study_ID, data, context, pred) %>% # Use sub-sample if available, filter(full_sample_num == max(full_sample_num, na.rm = TRUE)) %>% # Use model with least number of mediators filter(nr_mediators == min(nr_mediators)) %>% # Use model with min number of bad controls filter(nr_bad_controls == min(nr_bad_controls)) %>% # Use model with max number of good controls filter(nr_good_controls == max(nr_good_controls)) %>% # Use model with minimum number of integration predictors filter(nr_preds == min(nr_preds)) %>% ungroup()Note: Results are based on a multilevel random effects meta analysis. n = 20 partial correlation coefficients based on five coded studies and five different data sets.
Signs of mediation?
# Sample definition#------------------sample_2 <- meta_data %>% # Only broad integration indicators, filter(pred == "Education" | pred == "Generation" | pred == "Length of residency") %>% # Within each indep. sample & type of predictor, group_by(study_ID, data, context, pred) %>% # Use sub-sample if available, filter(full_sample_num == max(full_sample_num, na.rm = TRUE)) %>% # Use model with least number of mediators # filter(nr_mediators == min(nr_mediators)) %>% # Use model with min number of bad controls filter(nr_bad_controls == min(nr_bad_controls)) %>% # Use model with max number of good controls filter(nr_good_controls == max(nr_good_controls)) %>% # Use model with minimum number of integration predictors filter(nr_preds == min(nr_preds)) %>% ungroup()Signs of mediation?
# Sample definition#------------------sample_2 <- meta_data %>% # Only broad integration indicators, filter(pred == "Education" | pred == "Generation" | pred == "Length of residency") %>% # Within each indep. sample & type of predictor, group_by(study_ID, data, context, pred) %>% # Use sub-sample if available, filter(full_sample_num == max(full_sample_num, na.rm = TRUE)) %>% # Use model with least number of mediators # filter(nr_mediators == min(nr_mediators)) %>% # Use model with min number of bad controls filter(nr_bad_controls == min(nr_bad_controls)) %>% # Use model with max number of good controls filter(nr_good_controls == max(nr_good_controls)) %>% # Use model with minimum number of integration predictors filter(nr_preds == min(nr_preds)) %>% ungroup()Note: Results are based on a multilevel random effects meta analysis. n = 27 partial correlation coefficients based on five coded studies and five different data sets.
Scope condition Citizenship rights?
Note: Results are based on a multilevel random effects meta analysis. n = 20 partial correlation coefficients based on five coded studies and five different data sets.
Publication bias? p-curve analysis
# Sample definition#------------------pubbias_sample <- sample_1 %>% mutate( pred_num = case_when( pred == "Education" ~ 3, pred == "Generation" ~ 2, TRUE ~ 1)) %>% # Within each independent sample: group_by(study_ID, data, pop, context) %>% # Use preferable predictor, filter(pred_num == max(pred_num, na.rm = TRUE)) %>% # Finally, choose one at random. sample_n(1) %>% ungroup()Note: n = 12 and 6 p-values respectively.
Synthesized theoretical model
[...] greater familiarity with the culture and language and some economic advancement can lead to greater consciousness of the reality of discrimination.
-- Portes, Parker, and Cobas (1980)

Fundamental flaw of prior research
[...] greater familiarity with the culture and language and some economic advancement can lead to greater consciousness of the reality of discrimination.
-- Portes, Parker, and Cobas (1980)
Fundamental flaw of prior research
[...] greater familiarity with the culture and language and some economic advancement can lead to greater consciousness of the reality of discrimination.
-- Portes, Parker, and Cobas (1980)
False Consciousness: Are the less integrated under-perceiving the true extent of discrimination they face?
Limitation of correspondence studies
Fake CV's
have no experiences and feelings


A new experimental design
The Trust game
Two persons' mutual evaluation of their trustworthiness
We'll have endowments of €10
Respondents will play both roles & we define actual role randomly afterwards

A new experimental design
The Trust game
Two persons' mutual evaluation of their trustworthiness
We'll have endowments of €10
Respondents will play both roles & we define actual role randomly afterwards

Non-anonymous games
Profile photo & spoken sentence

Actual discrimination
Non-anonymous games
Profile photo & spoken sentence

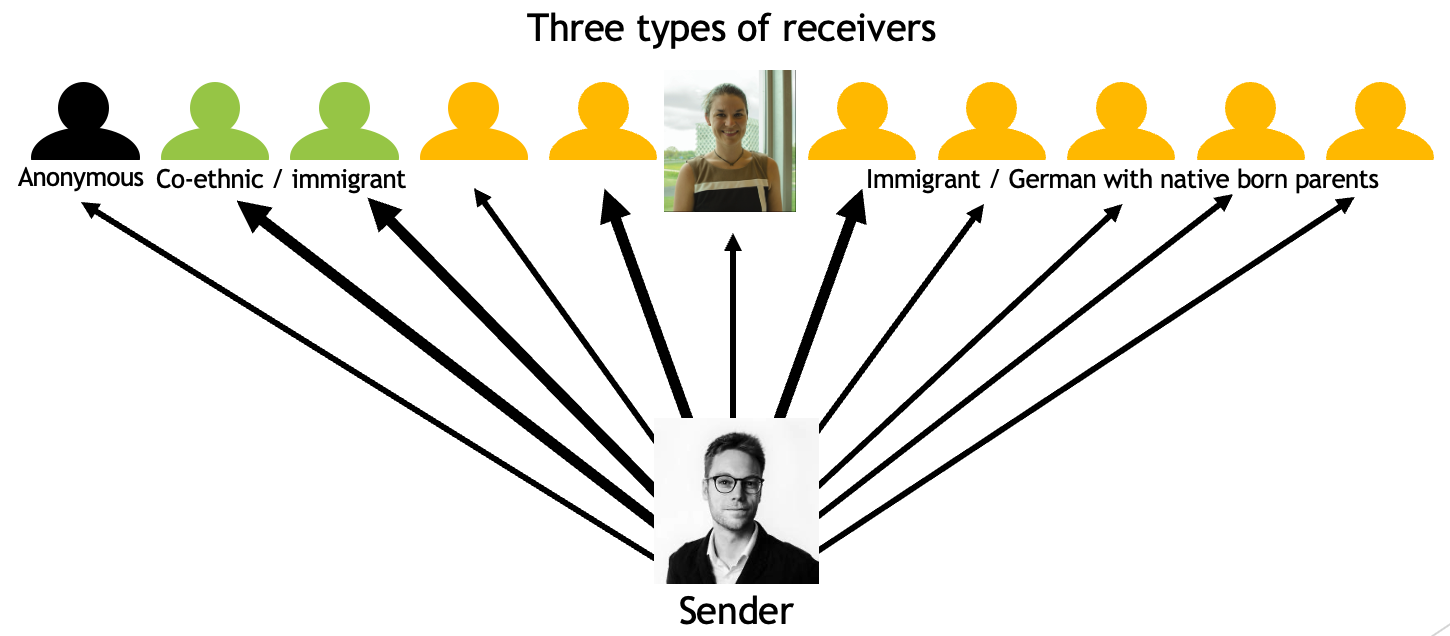
- €_{\text{Judith}} - \bar{€}_{\text{Co-ethnics}}, or €_{\text{Judith}} - €_{\text{anonymous}}
- Single measure: May be ethnic or not.
- Aggregated across 10 game partners: Ethnic discrimination.
- After all 11 games: Which two of the overall ten (non-anonymous) games do you want to have paid out?
Expected & perceived discrimination
Non-anonymous games
Profile photo & spoken sentence

Expected discrimination After all games are played: What do you think,
- Expected \Delta€ (incentivized, €4 for correct guess)
- how much did that game partner send you? \rightarrow €3
- how much did that game partner send other players? \rightarrow €5
- why did that game partner send you €2 less than the others?
- Do you think, that game partner chose your game as one of the two that are being paid out (incentivized, €2 for correct guess)
Perceived discrimination Three months later, respondents are informed about their aggregate personal and overall average payoffs.
- Why did you make less / more?
Implementation in three steps
1) Pre-game online survey
May 2021
- Photo & recorded sentence.
- Berlin, Hamburg, Cologne, Frankfurt, Munich.
- 1,500 Germans with native-born parents.
- 900 immigrants or children of immigrants.
- 600 Turkish immigrants or children of Turkish immigrants.
Implementation in three steps
2) Online trust games
October 2021
- n = 2,000.
- Not simultaneously but strategy method.
- Guaranteed €20, Average win €60, maximum €100.
Implementation in three steps
3) Final survey
January 2022
- Information about personal and overall payoffs.
Envisioned data n = 1,500 X 8 = 12,000
| Minority | Pot. discriminator | €_{i} - \bar{€}_{j(\text{Co-ethnics})} | Exp. \Delta_i€ | j selected i | i exp. selection | i Education | i ... |
|---|---|---|---|---|---|---|---|
| i=1 (Judith) | j=1 (Merlin) | -3 | -5 | 0 | 0 | ... | ... |
| i=1 (Judith) | j=2 | 0 | 0 | 1 | 0 | ... | ... |
| i=1 (Judith) | j=3 | 1 | 0 | 1 | 0 | ... | ... |
| i=1 (Judith) | j=4 | -1 | 0 | 1 | 1 | ... | ... |
| i=1 (Judith) | j=5 | -2 | 0 | 1 | 0 | ... | ... |
| i=1 (Judith) | j=6 | -4 | 0 | 1 | 0 | ... | ... |
| i=1 (Judith) | j=7 | 3 | 0 | 0 | 0 | ... | ... |
| i=1 (Judith) | j=8 | 0 | 0 | 0 | 0 | ... | ... |
| i=2 | j=1 (Merlin) | ... | ... | ... | ... | ... | ... |
| i=2 | j=4 | ... | ... | ... | ... | ... | ... |
| i=2 | j=9 | ... | ... | ... | ... | ... | ... |
| i=2 | j=10 | ... | ... | ... | ... | ... | ... |
Conclusion
- Tocqueville's / integration paradox:
- Interesting phenomenon & maybe rather pervasive.
- Related to (Marxist) claims about false consciousness.
- Hefty implications for interview/survey based reports.
- No good toolbox to study these phenomena.
- Training pre-reg (multilevel) meta-analysis:
- Interesting tool for sociology despite violated assumptions?
- Integration paradox seems credible.
- The new experimental design:
- Artificial, but first attempt to measure & predict individuals' under- and over-perceived discrimination.
- Mis-perceptions may also be used as predictor, e.g. of political mobilization.
Thank you for your attention!
References
European Union Agency for Fundamental Rights. (2014). Violence against women :an EU wide survey : results at a glance. LU: Publications Office.
Gustafson, R. L. (1961). "Partial Correlations in Regression Computations". In: Journal of the American Statistical Association, pp. 363-367.
Konstantopoulos, S. (2011). "Fixed effects and variance components estimation in three-level meta-analysis". In: Research Synthesis Methods, pp. 61-76.
Portes, A., R. N. Parker, and J. A. Cobas (1980). "Assimilation or Consciousness". In: Social Forces, pp. 200-224.
Tocqueville, A. d. (2015). Democracy in America - Vol. I. and II. Read Books Ltd.
Viechtbauer, W. (2010). "Conducting Meta-Analyses in R with the metafor Package". In: Journal of Statistical Software, pp. 1-48.
Appendix
Which social / psychological process?
## Sample definitionsample_3 <- meta_data %>% # Only broad integration indicators and full samples. filter(pred == "Social exposure" | pred == "Labor market attainment" | pred == "Cognitive awareness" | pred == "Disillusion") %>% # Within each independent sample & type of predictor, group_by(study_ID, data, context, pred) %>% # Use sub-sample if available, filter(full_sample_num == max(full_sample_num, na.rm = TRUE)) %>% # Use model with least number of mediators filter(nr_mediators == min(nr_mediators)) %>% # Use model with min number of bad controls filter(nr_bad_controls == min(nr_bad_controls)) %>% # Use model with max number of good controls filter(nr_good_controls == max(nr_good_controls)) %>% # Use model with minimum number of integration predictors # filter(nr_preds == min(nr_preds)) %>% ungroup()Note: n = 34 partial correlation coefficients based on five coded studies and five different data sets.
Small-sample publication bias? Trim and fill analysis

Note: Results are based on (multilevel, Original model) random effects meta analyses.