The Effect of Integration Policies in Denmark
Balance Tests and Sampling Design
Merlin Schaeffer (KU) & Teresa Freitas Monteiro (CERGE-EI)
2026-10-05
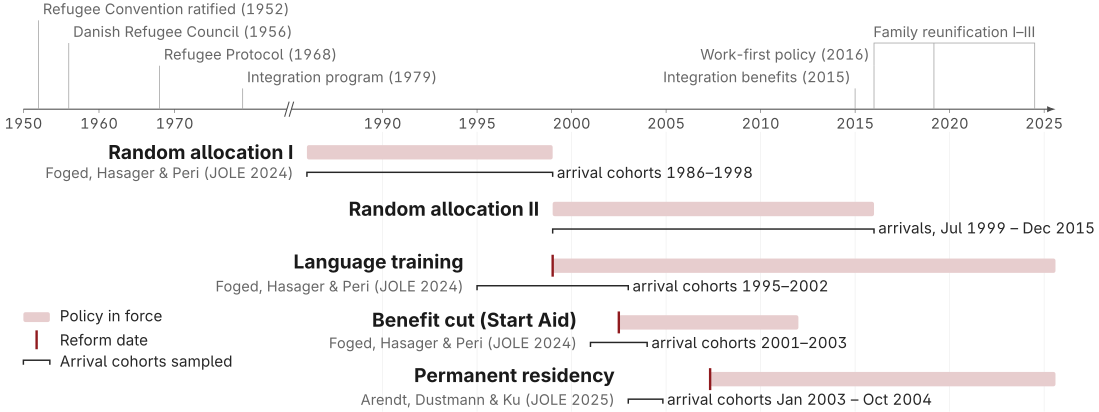
Danish refugee policies, 1950–2025
Policies are placed at the date they took effect.
What the reference studies found
| Study | Refugees | Their children | |
|---|---|---|---|
| Placement 1986–1998 | Foged, Hasager & Peri (2024); Damm & Dustmann (2014) | A strong local labour market raises long-run employment and earnings; placement near co-nationals does not | More convicted youths in the assigned neighbourhood means more convictions later, among boys only |
| Placement 1999–2015 | Azlor, Damm & Schultz-Nielsen (2020); Diop-Christensen et al. (2024) | A municipality with a 1 pp higher employment rate raises employment by .5–.6 pp after two to four years; the three-year residence requirement delays moving but does not prevent it | Not studied |
| Language training 1999 | Foged, Hasager, Peri, Arendt & Bolvig (2024, 2023) | Permanent earnings gains, more schooling, more communication-intensive jobs | Higher lower-secondary completion and less juvenile crime, driven by boys below school age when the parents were trained |
| Welfare cut 2002 | Dustmann, Landersø & Andersen (2024) | Employment up in the short run only; poverty and subsistence crime up | Lower language test scores, fewer years of schooling, teenage crime roughly doubled |
| Permanent residency 2002 | Arendt, Dustmann & Ku (2025) | Employment of those affected fell and language proficiency barely moved: discouragement at the bottom | Not studied |
Damm & Dustmann, AER 104(6), 1806–32. Foged, Hasager & Peri, JOLE 42(S1), S335–S377. Foged, Hasager, Peri, Arendt & Bolvig, ReStat 106(4), 1157–66, and Journal of Public Economics (2023). Dustmann, Landersø & Andersen, AEJ: Economic Policy 16(2), 406–41. Arendt, Dustmann & Ku, JOLE 43(2), 293–318. Azlor, Damm & Schultz-Nielsen, Labour Economics 63, 101808 (dispersal 1999–2010). Diop-Christensen, Diop & Munzula, JEMS 51(15), 3866–88. Every outcome here comes from registers — schooling, earnings, convictions. None of these studies observes what people think, feel or report about the policies.
Identification strategies
Quasi-random placement
\[ \begin{aligned} y_{is} = {} & \beta_0 + \color{#901A1E}{\tau}\,\text{Z}_{mt} \\ & + X_i\beta_k + \text{cohort}_i + \varepsilon_{ism} \end{aligned} \]
\(Z\) municipality characteristics of municipality \(m\): first municipality (year \(t\)); \(X_i\): characteristics known at placement; \(s\): date of permission.
- Random allocation I: arrivals 1986–1998
- Random allocation II: arrivals Jul 1999 – Dec2015
- Assumption: given origin and family type, placement is random
- Balance test: individual characteristics do not predict municipality characteristics
Discontinuity in asylum date
\[ \begin{aligned} y_{is} = {} & \beta_0 + \color{#901A1E}{\tau} D_i \\ & + \beta_1 (a_i - c) \\ & + \beta_2 D_i \times (a_i - c)\\ & + X_i'\beta_3 + \varepsilon_{is} \end{aligned} \]
\(a_i\): asylum date; \(c\): cutoff; \(D_i = \mathbf{1}[a_i \ge c]\); triangular kernel, 548-day bandwidth.
- Language training: cutoff 1 Jan 1999
- Start Aid: cutoff 1 Jul 2002
- Assumption: refugees granted asylum just before and after the cutoff are comparable
- Balance test: no jump in predetermined characteristics at the cutoff
Difference-in-differences
\[ \begin{aligned} y_{i\tau} = {} & \alpha_i + \psi_\tau + \color{#901A1E}{\delta}\,\text{Post}_\tau \times T_i \\ & + X_{t(i\tau)}'\beta + u_{i\tau} \end{aligned} \]
\(\tau\): years since residency; \(T_i\): residency Jan–Oct 2004; \(\text{Post}_\tau = \mathbf{1}[\tau \ge 3]\).
- Permanent residency: residency Jan–Oct 2004 (treated) vs. Jan–Oct 2003 (control)
- Assumption: parallel trends without the reform
- Balance test: similar characteristics and outcomes in years 1–2
Designs follow Foged, Hasager & Peri (2024) and Arendt, Dustmann & Ku (2025).
Balance tests
Balance in reference studies
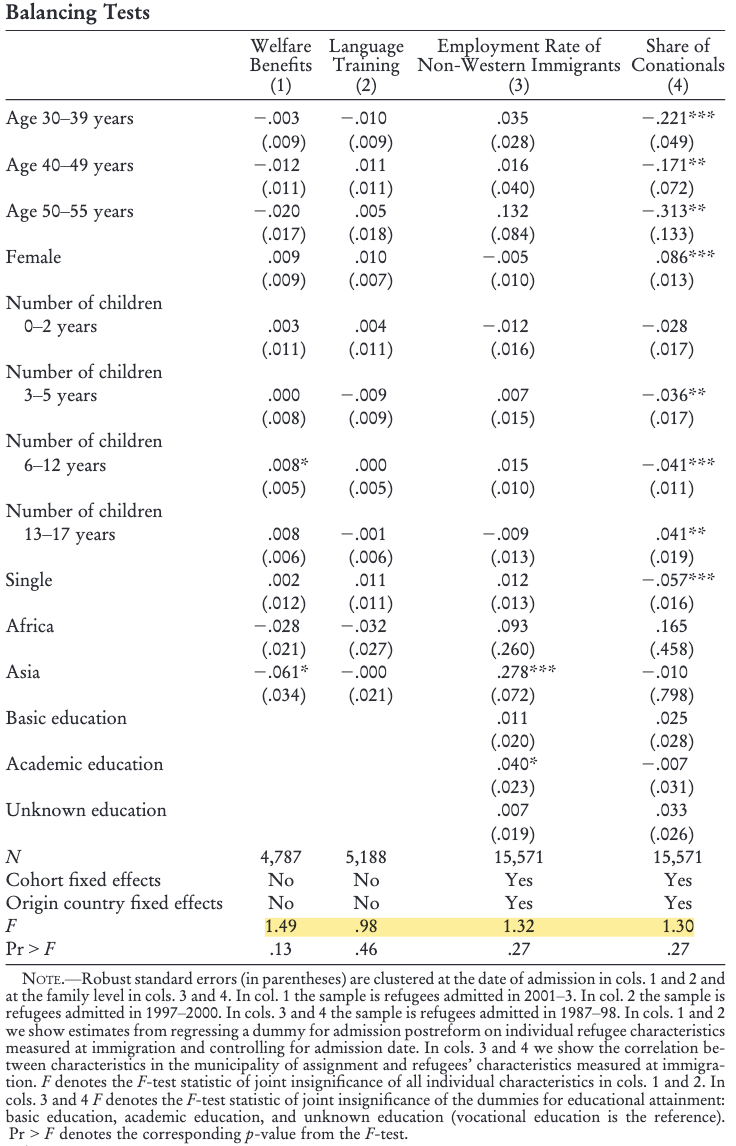
Foged, Hasager & Peri (2024), Table 4.
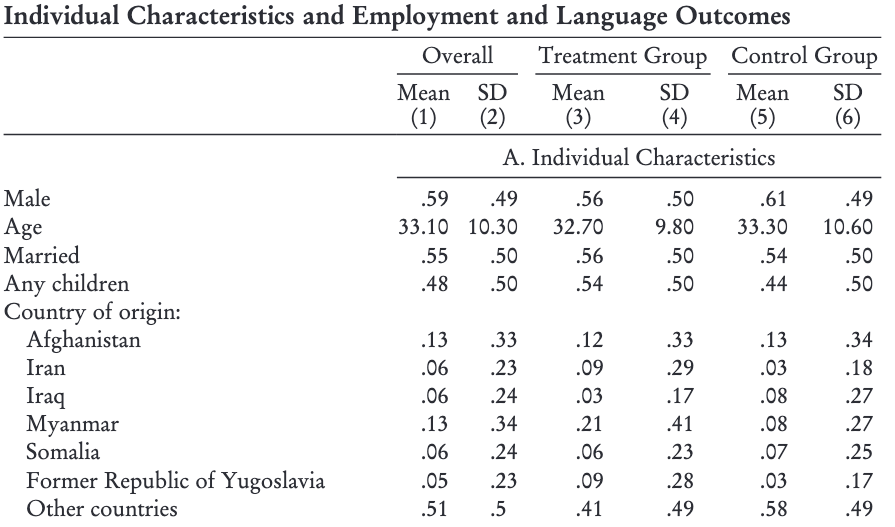
Arendt, Dustmann & Ku (2025), Table 1.
Welfare cut
Foged, Hasager & Peri (2024)
|
Our data
|
||
|---|---|---|---|
| Welfare benefits (col. 1) | Replication | Our sample | |
| Age 30–39 years | −.003 (.009) | .007 (.009) | .003 (.010) |
| Age 40–49 years | −.012 (.011) | −.002 (.011) | .001 (.012) |
| Age 50–55 years | −.020 (.017) | −.021 (.017) | −.033* (.019) |
| Female | .009 (.009) | .016* (.009) | .015 (.010) |
| Children 0–2 years | .003 (.011) | −.004 (.009) | −.005 (.010) |
| Children 3–5 years | .000 (.008) | −.007 (.008) | −.001 (.007) |
| Children 6–12 years | .008* (.005) | −.003 (.005) | .002 (.005) |
| Children 13–17 years | .008 (.006) | −.001 (.006) | .000 (.006) |
| Single | .002 (.012) | −.007 (.012) | −.004 (.012) |
| Africa | −.028 (.021) | −.027 (.021) | −.023 (.021) |
| Asia | −.061* (.034) | −.065* (.035) | −.078** (.039) |
| N | 4,787 | 4,572 | 4,176 |
| F | 1.49 | 1.01 | 1.07 |
| Pr > F | .13 | .44 | .38 |
| F, adding Middle East | – | – | 2.18 |
| Pr > F | – | – | .01 |
OLS of a post-reform dummy on characteristics and asylum date, SEs clustered by date. Replication: Foged et al.’s code on our data. Our sample: aged 18–55 at entry, in Denmark in 2024, ±548 days. Reference: age 18–29, Middle East, Europe, and other regions. Timing: Foged et al. (2024) measure children and marital status in the first register year 1–5 years after the reform year, for refugees admitted before the reform partly after it; our sample measures them in the first register year after arrival. * p < .10, ** p < .05, *** p < .01.
Welfare cut: is the admission date manipulated?
| Window | Jump at the cutoff | Pr > |T| | |
|---|---|---|---|
| Daily density test (rddensity) | ±548 days | T = 1.31 | .19 |
| Monthly admissions, raw share | ±12 months | +3.78 pp | .33 |
| … net of seasonality | ±12 months | +0.20 pp | .91 |
| … net of seasonality | ±24 months | +0.48 pp | .94 |
| … net of seasonality, OLS | ±24 months | +0.29 pp | .88 |
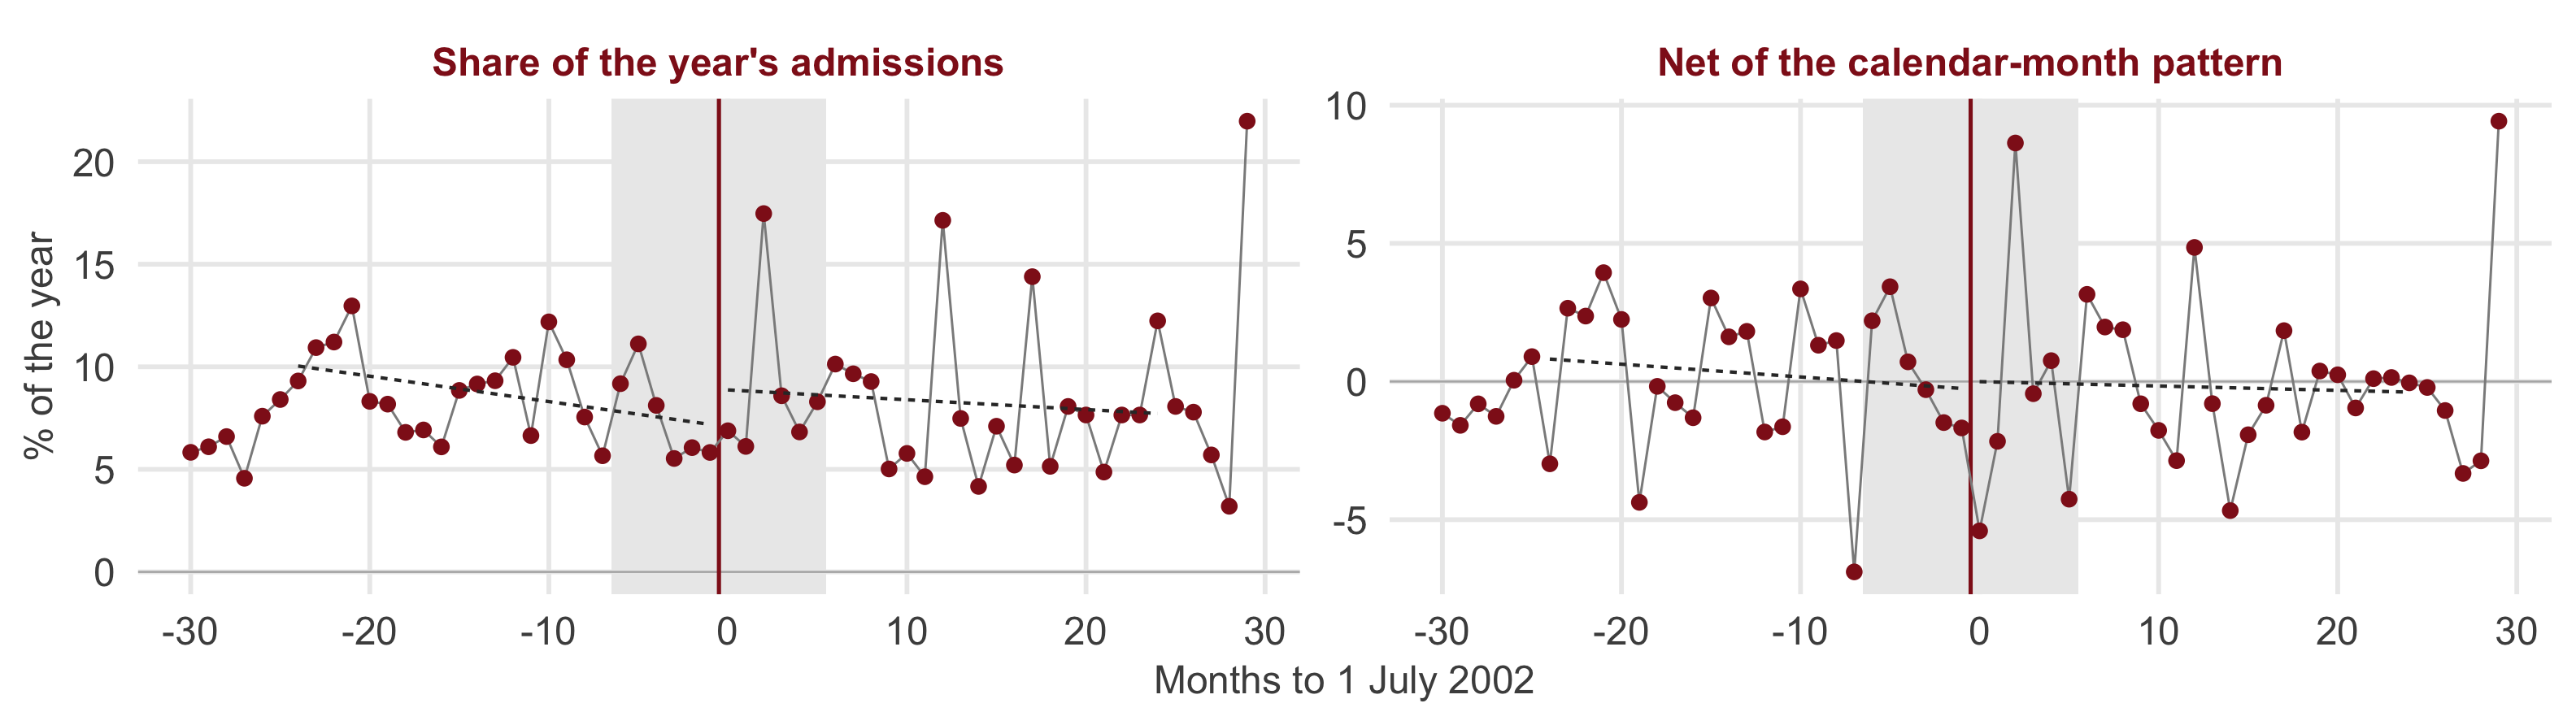
Refugees admitted 2000–2004, aged 18–55, excluding Afghanistan and Bosnia-Herzegovina, as in the balance test. The density test asks whether the daily number of permits jumps at 1 July 2002 (Cattaneo, Jansson & Ma). The monthly tests take each month’s share of its own year’s admissions and subtract what that calendar month usually is. The shaded band is the year around the cutoff, which is left out when the usual monthly pattern is computed; the red line is the reform date.
Language training
Foged, Hasager & Peri (2024)
|
Our data
|
||
|---|---|---|---|
| Language training (col. 2) | Replication | Our sample | |
| Age 30–39 years | −.010 (.009) | −.010 (.009) | −.006 (.009) |
| Age 40–49 years | .011 (.011) | .012 (.011) | .010 (.012) |
| Age 50–55 years | .005 (.018) | .010 (.018) | .030 (.022) |
| Female | .010 (.007) | .008 (.008) | .008 (.008) |
| Children 0–2 years | .004 (.011) | .016 (.011) | .009 (.011) |
| Children 3–5 years | −.009 (.009) | −.014* (.008) | −.013 (.008) |
| Children 6–12 years | .000 (.005) | .001 (.005) | .000 (.005) |
| Children 13–17 years | −.001 (.006) | −.002 (.005) | .001 (.006) |
| Single | .011 (.011) | .005 (.012) | .004 (.012) |
| Africa | −.032 (.027) | −.030 (.027) | −.025 (.028) |
| Asia | −.000 (.021) | −.004 (.023) | −.012 (.026) |
| N | 5,188 | 5,018 | 4,680 |
| F | .98 | 1.13 | .88 |
| Pr > F | .46 | .34 | .56 |
| F, adding Middle East | – | – | 1.58 |
| Pr > F | – | – | .09 |
OLS of a post-reform dummy on characteristics and asylum date, SEs clustered by date. Replication: Foged et al.’s code on our data. Our sample: aged 18–55 at entry, in Denmark in 2024, ±548 days. Reference: age 18–29, Middle East and other regions. Timing: Foged et al. (2024) measure children and marital status in the first register year 1–5 years after the reform year, for refugees admitted before the reform partly after it; our sample measures them in the first register year after arrival. * p < .10, ** p < .05, *** p < .01.
Language training: is the admission date manipulated?
| Window | Jump at the cutoff | Pr > |T| | |
|---|---|---|---|
| Daily density test (rddensity) | ±548 days | T = −4.08 | < .01 |
| Monthly admissions, raw share | ±12 months | −2.80 pp | .15 |
| … net of seasonality | ±12 months | +0.21 pp | .91 |
| … net of seasonality | ±24 months | −0.31 pp | .90 |
| … net of seasonality, OLS | ±24 months | −0.12 pp | .93 |
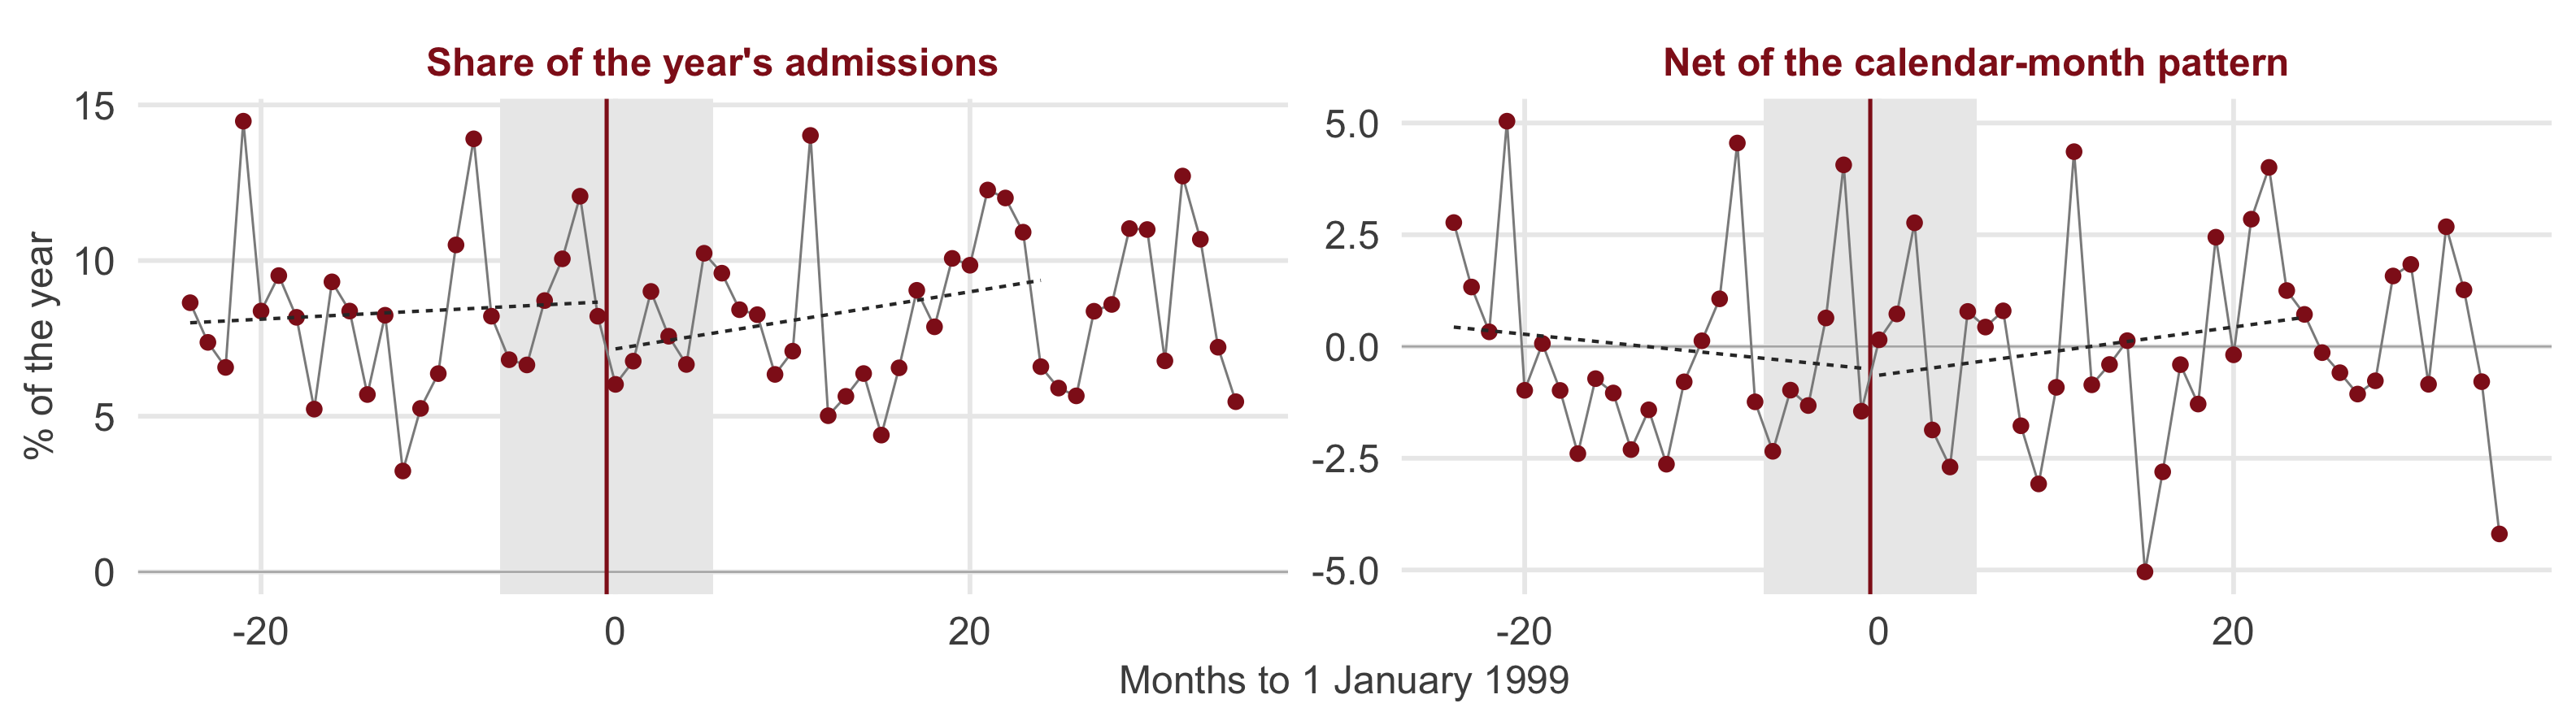
Refugees admitted 1997–2001 (the permit register starts in 1997), aged 18–49, excluding Somalia, as in Arendt et al. The daily test rejects because permits pile up before the turn of the year: the reform date is 1 January, so the seasonal pattern and the cutoff coincide by construction. The monthly tests remove that pattern. The shaded band is the year around the cutoff, which is left out when the usual monthly pattern is computed; the red line is the reform date.
Still in Denmark in 2024?
| Still here in 2024 | Jump at the cutoff | Pr > |T| | Refugees | |
|---|---|---|---|---|
| Welfare cut (1 Jul 2002) | .895 | .041* (.023) | .08 | 4,608 |
| Language training (1 Jan 1999) | .905 | −.015 (.019) | .44 | 5,021 |
* p < .10, ** p < .05, *** p < .01.
Initial municipality placement
Foged, Hasager & Peri (2024)
|
Our data
|
|||
|---|---|---|---|---|
| Share of co-nationals (col. 4) | Replication | 1986–1998 | 1999–2015 | |
| Tested: not known to the authorities | ||||
| Basic education | .025 (.028) | .061* (.033) | .053 (.033) | .003 (.020) |
| Academic education | −.007 (.031) | .031 (.036) | .001 (.036) | −.004 (.022) |
| Unknown education | .033 (.026) | .074** (.030) | .047 (.030) | .048** (.023) |
| Known to the authorities | ||||
| Age 30–39 years | −.221*** (.049) | −.194*** (.056) | −.188*** (.058) | −.020 (.012) |
| Age 40–49 years | −.171** (.072) | −.227*** (.080) | −.210** (.089) | −.009 (.022) |
| Age 50–55 years | −.313** (.133) | −.304** (.146) | −.351** (.178) | −.076*** (.028) |
| Female | .086*** (.013) | .069*** (.016) | .058*** (.016) | .080*** (.011) |
| Children 0–2 years | −.028 (.017) | −.004 (.018) | .032 (.020) | .015 (.012) |
| Children 3–5 years | −.036** (.017) | .009 (.019) | .011 (.020) | −.013 (.011) |
| Children 6–12 years | −.041*** (.011) | −.027** (.011) | −.038*** (.011) | −.012* (.007) |
| Children 13–17 years | .041** (.019) | −.009 (.017) | −.003 (.018) | .013 (.010) |
| Single | −.057*** (.016) | −.067*** (.020) | −.062*** (.019) | −.062*** (.013) |
| Africa | .165 (.458) | −.454*** (.144) | −.423** (.168) | −.160*** (.052) |
| Asia | −.010 (.798) | −.748*** (.140) | −.786*** (.121) | −.164*** (.048) |
| N | 15,571 | 14,323 | 15,564 | 21,476 |
| F | 1.30 | 2.37 | 1.78 | 3.66 |
| Pr > F | .27 | .07 | .15 | .01 |
Standardised share of co-nationals in the first municipality on characteristics, origin and cohort fixed effects; SEs clustered by family. F-test: education only. Replication: Foged et al.’s sample definition on our data, arrivals 1987–1998. The last two columns are our own frame, for the two allocation regimes: the Danish Refugee Council’s placement up to 1998, and municipal quotas under the Integration Act from 1999. * p < .10, ** p < .05, *** p < .01.
Permanent residency
Arendt, Dustmann & Ku (2025)
|
Replication, asylum permits
|
Our sample
|
|||||||
|---|---|---|---|---|---|---|---|---|---|
| Treated | Control | Difference | Treated | Control | Difference | Treated | Control | Difference | |
| Male | .56 | .61 | −.05 (.04) | .57 | .64 | −.069*** (.026) | .41 | .46 | −.045* (.023) |
| Age (years) | 32.70 | 33.30 | −0.60 (0.74) | 32.69 | 33.27 | −0.58 (0.46) | 33.04 | 33.05 | −0.01 (0.40) |
| Married† | .56 | .54 | .02 (.04) | .62 | .67 | −.051** (.025) | .72 | .77 | −.055*** (.021) |
| Any children | .54 | .44 | .10*** (.04) | .61 | .58 | .025 (.026) | .71 | .68 | .027 (.022) |
| Country of origin | |||||||||
| Afghanistan | .12 | .13 | −.01 (.02) | .11 | .20 | −.093*** (.018) | .19 | .20 | −.008 (.019) |
| Iran | .09 | .03 | .06*** (.02) | .07 | .07 | .001 (.013) | .06 | .06 | .004 (.011) |
| Iraq | .03 | .08 | −.05*** (.02) | .05 | .13 | −.087*** (.014) | .13 | .25 | −.129*** (.018) |
| Myanmar | .21 | .08 | .13*** (.03) | .12 | .04 | .087*** (.015) | .10 | .03 | .071*** (.012) |
| Somalia | .06 | .07 | −.01 (.02) | .03 | .04 | −.003 (.010) | .04 | .04 | −.001 (.009) |
| Former Yugoslavia | .09 | .03 | .06*** (.02) | .24 | .18 | .061*** (.022) | .19 | .14 | .049*** (.018) |
| Other countries | .41 | .58 | −.17*** (.04) | .38 | .35 | .034 (.025) | .29 | .28 | .012 (.021) |
| Individuals | 314 | 453 | 575 | 953 | 722 | 1,186 | |||
Treated: arrived Jan–Oct 2004; control: Jan–Oct 2003. Arendt et al.: Table 1; differences and SEs computed from their means, SDs and group sizes. Replication and our sample: the same variables computed by the same code, so all three columns are comparable row by row. Replication uses their sample definition on our data, asylum permits only, as a stand-in for their filter on asylum applications after 28 February 2002 (data we do not get — it is held by the ministry, not DST). Our sample: 18–55 at entry, in Denmark in 2024, all permit types. † Arendt et al.: legally married; ours: married or registered partnership. * p < .10, ** p < .05, *** p < .01.
Sampling DK-born children of refugees
Part 2 of 3
Welfare cut and language training: children and marriage
Welfare cut (1 Jul 2002)
|
Language training (1 Jan 1999)
|
|||||
|---|---|---|---|---|---|---|
| Mean | Effect | + controls | Mean | Effect | + controls | |
| Births registered in Denmark† | ||||||
| All births after the permit | 1.40 | −0.35*** (0.13) | −0.30*** (0.11) | 1.36 | −0.03 (0.09) | 0.00 (0.07) |
| births 1–5 years after the permit | 0.54 | −0.07 (0.07) | −0.08 (0.05) | 0.52 | −0.04 (0.05) | −0.02 (0.04) |
| Years from permit to first birth‡ | 3.97 | −0.13 (0.40) | −0.04 (0.27) | 4.11 | 0.13 (0.34) | 0.59** (0.27) |
| Births under 2500 g | .028 | .003 (.015) | .002 (.016) | .026 | −.004 (.015) | −.004 (.016) |
| Mean birth weight, g‡ | 3,404 | 33 (70) | 60 (68) | 3,418 | −53 (54) | −77 (53) |
| Children born before the permit | 1.64 | 0.14 (0.18) | 0.03 (0.07) | 1.70 | −0.22* (0.12) | −0.18*** (0.04) |
| Children living in Denmark in 2025§ | ||||||
| Born in Denmark | 1.37 | −0.32** (0.13) | −0.25** (0.11) | 1.34 | −0.07 (0.10) | −0.06 (0.07) |
| both parents immigrants | 1.34 | −0.33** (0.13) | −0.26** (0.11) | 1.30 | −0.08 (0.10) | −0.07 (0.07) |
| a Danish-born Danish-citizen parent | 0.03 | 0.02 (0.02) | 0.02 (0.02) | 0.04 | 0.01 (0.02) | 0.01 (0.02) |
| born 1–5 years after the permit | 0.51 | −0.06 (0.06) | −0.07 (0.05) | 0.49 | −0.04 (0.05) | −0.02 (0.04) |
| Born abroad after the parent arrived | 0.02 | −0.02* (0.01) | −0.02 (0.01) | 0.03 | 0.02 (0.01) | 0.02 (0.01) |
| 5 years after the permit | ||||||
| Married | .768 | .010 (.041) | −.014 (.020) | .798 | −.013 (.028) | −.022 (.018) |
| Spouse registered in Denmark¶ | .653 | .010 (.048) | −.026 (.030) | .733 | −.004 (.029) | −.014 (.020) |
| came by family reunification | .187 | −.016 (.029) | −.024 (.029) | .274 | −.029 (.031) | .011 (.022) |
| is a refugee | .416 | .052 (.052) | .022 (.033) | .399 | .013 (.039) | −.028 (.027) |
| Danish-born or other immigrant | .051 | −.025* (.015) | −.024 (.015) | .060 | .012 (.013) | .003 (.013) |
| Married, spouse not in Denmark | .115 | .000 (.024) | .013 (.024) | .065 | −.008 (.014) | −.008 (.015) |
| Refugees | 4,176 | 4,671 | ||||
Discontinuity at the reform date, ±548 days, SEs clustered by date; controls: pre-treatment characteristics incl. Middle East. § Children living in Denmark in 2025 with a parent in our sample. ¶ Spouse ID in that year’s population register. * p < .10, ** p < .05, *** p < .01.
Is the drop in children about spouses?
Welfare cut (1 Jul 2002)
|
Language training (1 Jan 1999)
|
|||||
|---|---|---|---|---|---|---|
| All | Spouse not abroad | Spouse abroad | All | Spouse not abroad | Spouse abroad | |
| Births and children | ||||||
| All births after the permit | −0.35*** (0.13) | −0.27** (0.14) | −0.73* (0.40) | −0.03 (0.09) | −0.01 (0.09) | −0.25 (0.36) |
| births 1–5 years after the permit | −0.07 (0.07) | −0.04 (0.07) | −0.22 (0.14) | −0.04 (0.05) | −0.03 (0.05) | −0.09 (0.19) |
| Children in Denmark in 2025 | −0.32** (0.13) | −0.28** (0.14) | −0.49 (0.39) | −0.07 (0.10) | −0.06 (0.10) | −0.21 (0.34) |
| both parents immigrants | −0.33** (0.13) | −0.31** (0.14) | −0.47 (0.40) | −0.08 (0.10) | −0.06 (0.10) | −0.34 (0.33) |
| a Danish-born Danish-citizen parent | 0.02 (0.02) | 0.02 (0.02) | −0.02 (0.03) | 0.01 (0.02) | −0.00 (0.02) | 0.13 (0.12) |
| Born abroad after the parent arrived | −0.02* (0.01) | −0.03** (0.01) | 0.02 (0.06) | 0.02 (0.01) | 0.02 (0.01) | 0.04 (0.07) |
| 5 years after the permit | ||||||
| Married | .010 (.041) | .014 (.047) | .002 (.075) | −.013 (.028) | −.006 (.030) | −.095 (.097) |
| Spouse registered in Denmark | .010 (.048) | .016 (.048) | −.028 (.096) | −.004 (.029) | .005 (.030) | −.170 (.116) |
| came by family reunification | −.016 (.029) | −.016 (.031) | −.016 (.086) | −.029 (.031) | −.019 (.032) | −.091 (.128) |
| Married, spouse not in Denmark | .000 (.024) | −.002 (.020) | .029 (.093) | −.008 (.014) | −.012 (.014) | .075 (.095) |
| Refugees | 4,176 | 3,628 | 548 | 4,671 | 4,286 | 385 |
Discontinuities without controls. “Spouse abroad”: married in the first register year, no spouse registered in Denmark. * p < .10, ** p < .05, *** p < .01.
Sampling design
Part 3 of 3
We can send invitations to 60.000 people
Refugees
|
Their Danish-born children
|
|||||
|---|---|---|---|---|---|---|
| All | Treated | Control | All | Treated | Control | |
| Placement 1986-1998 | 15,576 (14,490) | – | – | 22,651 (21,307) | – | – |
| Placement 1999-2015 | 21,495 (17,134) | – | – | 4,156 (1,350) | – | – |
| Language training 1999 | 4,680 (2,223) | 2,576 (1,206) | 2,104 (1,017) | 2,903 (781) | 1,421 (387) | 1,482 (394) |
| Welfare cuts 2002 | 4,176 (1,153) | 1,602 (1) | 2,574 (1,152) | 1,940 (247) | 483 (0) | 1,457 (247) |
| Permanent residency 2003/4 | 1,908 (509) | 722 (282) | 1,186 (227) | 784 (110) | 241 (65) | 543 (45) |
Everyone still registered in Denmark at the latest available year: refugees in each policy’s estimation window, and their children born in Denmark, alive here in 2025 and at least 18 years old. In brackets: those exposed to this policy only, that is, not in the treatment or control group of any other policy. Placement was assigned as a continuous share of co-nationals in the municipality, so it has no arms. A child counts once per policy, whichever parent links them to it. The second table counts refugees who fall in both windows; every pair not shown shares nobody — the two placement regimes are disjoint by construction, and the language reform meets neither the welfare cut nor permanent residency.
| Refugees in both windows | Placement 1986–1998 | Placement 1999–2015 | Welfare 2002 |
|---|---|---|---|
| Language training 1999 | 1,086 | 1,371 | |
| Welfare cuts 2002 | 2,473 | ||
| Permanent residency | 849 | 882 |
Thank you
Merlin & Teresa
Permanent residency: does a donut help?
Dropped on each side of the changeover
|
||||
|---|---|---|---|---|
| None | 3 months | 6 months | 9 months | |
| Age at entry | ||||
| 18–29 years | .016 (.023) | −.001 (.029) | −.013 (.037) | −.101 (.062) |
| 30–39 years | −.029 (.023) | −.007 (.029) | .011 (.037) | .068 (.065) |
| 40–49 years | .007 (.019) | −.007 (.023) | −.022 (.030) | .037 (.054) |
| 50–55 years | .006 (.010) | .015 (.013) | .024 (.018) | −.003 (.025) |
| Children at entry | ||||
| 0–2 years | .037 (.025) | .033 (.031) | .033 (.040) | .076 (.072) |
| 3–5 years | −.031 (.023) | −.031 (.029) | −.031 (.033) | −.030 (.046) |
| 6–12 years | −.023 (.048) | −.034 (.062) | −.070 (.074) | −.105 (.123) |
| 13–17 years | .115*** (.042) | .123** (.052) | .110* (.067) | .195 (.129) |
| Female | .045* (.023) | .033 (.029) | .007 (.038) | .027 (.066) |
| Married | −.055*** (.021) | −.070*** (.026) | −.079** (.034) | −.083 (.061) |
| Region of origin | ||||
| Middle East | −.120*** (.023) | −.185*** (.029) | −.188*** (.038) | −.281*** (.064) |
| Europe | .079*** (.020) | .093*** (.025) | .073** (.031) | .213*** (.056) |
| Africa | .007 (.016) | .051** (.021) | .075*** (.029) | −.006 (.048) |
| Asia | .034** (.017) | .035** (.016) | .027 (.020) | .051 (.038) |
| Other region | .001 (.003) | .006 (.004) | .012* (.007) | .024 (.017) |
| Joint F (p) | 3.63 (< .01) | 3.61 (< .01) | 2.51 (< .01) | 2.00 (.03) |
| Joint F, adding Middle East | 6.30 (< .01) | 6.33 (< .01) | 3.76 (< .01) | 4.93 (< .01) |
| Individuals | 1,908 | 1,261 | 819 | 267 |
Difference between the 2004 and 2003 cohorts, robust SEs, as on the previous slide. Each column drops more of the weeks closest to the changeover, where people whose asylum application fell under the old rules are most likely to be mixed in with people under the new ones. Widening the gap also pushes the two cohorts further apart in calendar time and cuts the sample, so it trades one bias for another rather than removing it. * p < .10, ** p < .05, *** p < .01.

Integration policies in Denmark